
a340bangla1
-
Posts
77 -
Joined
-
Last visited
a340bangla1's Achievements
")


-
Concur concerning APC. We have mostly good experiences with them. There is a utility to be downloaded that allows to control operation, among others to shut down the computer if the battery charge of the UPS becomes too low. for an AIO the 500 VA version is probably enough. As far as the battery is concerned, I have found the same 7Ah battery in most brands. Just make sure that whatever you buy allows battery replacement. As an average, I need to change mine about every 2 years. Batteries are available on Lazada too.
-
Had similar information recently from a friend who also renews there. No such information about other immi offices.
-
We have a number of 60 W and one 100 W around the house and in the garden. Also some recently bought 5 W post lights. They all work quite well. Usually, when we get up in the morning around 6 - 6:30 most of them are still working, albeit not so bright any more.
-
Recommend colonoscopy dr at Bumrungrad?
a340bangla1 replied to advancebooking's topic in Health and Medicine
Similar experience in 2014. Can only recommend him. -
Have not done a TM30 lately, but for 90 days you do not need a ticket, just go in through the first door, drop off your passport at the desk and come back a while later. I had breakfast on the other side and passport was ready by then. This week on Wednesday morning.
-
You know the saying of going into one ear and out the other ? ????
-
Banks refusing to witness Life Certificates for UK Pension Service now?
a340bangla1 replied to pollyog's topic in Pattaya
I get my pension from the Swiss AHV and their letter always comes about this time of the year. -
Banks refusing to witness Life Certificates for UK Pension Service now?
a340bangla1 replied to pollyog's topic in Pattaya
Not verified but: Somebody told just me this morning that the police station at Soi 9 (close to Central Festival) will gladly render the service for 200 B. Mine will come up in about 6 weeks and will then test it. -
We had about the same experience, definitely the mumbo-jumbo method of finding water. We struck water at about 60 metres (East Pattaya) - about 10 years ago, it is still working. But using the water for anything else but the garden was a day-dream....
-
Ubonjoe has passed away - Funeral tomorrow May 8 at 2pm
a340bangla1 replied to george's topic in Isaan
RIP. The ultimate source of knowledge of all things concerning immigration. -
Where is a good breakfast/brunch buffet in Pattaya/Jomtien/Naklua?
a340bangla1 replied to Steven55's topic in Pattaya
Casa Pascal breakfast buffet is back - on Sundays only -
I would agree to that. One of our two dogs only looks like a Bang Kaew (colors of the fur) but every Thai is deadly scared of her. And the whole neighborhood thinks we have a Bang Kaew. And she barks as soon as someone comes close to our gate. To think we picked her up 9 years ago in the woods around here.... And no, our dogs also are not allowed into the house and they know it.
-
My my... and what nationality are you an oaf or jerk of ?
-
The perspective is not so good, but it seems to have a center gear, so it really must be the A340-500 (HS-TYV). I first thought it is a B737. The RTAF does have a passenger jet fleet of some Airbus 319/320's, some B737's and one A340-500. There are also 3 Sukhoi Superjets 100, which do not seems to see a lot of flying.... (see wikipedia: https://en.wikipedia.org/wiki/List_of_aircraft_of_the_Royal_Thai_Air_Force) Which one of those they want to replace is not clear. Whoever wrote that article does not really have a particularly deep knowledge of aviation. The A340 has flown to Turkey a couple of times lately, I suppose on humanitarian missions. As far as I know from FR24, it has also spent quite some time in Lufthansa's workshop in Hamburg last year - probably for upgrades inside and out. So I somehow doubt it is up for replacement.
-
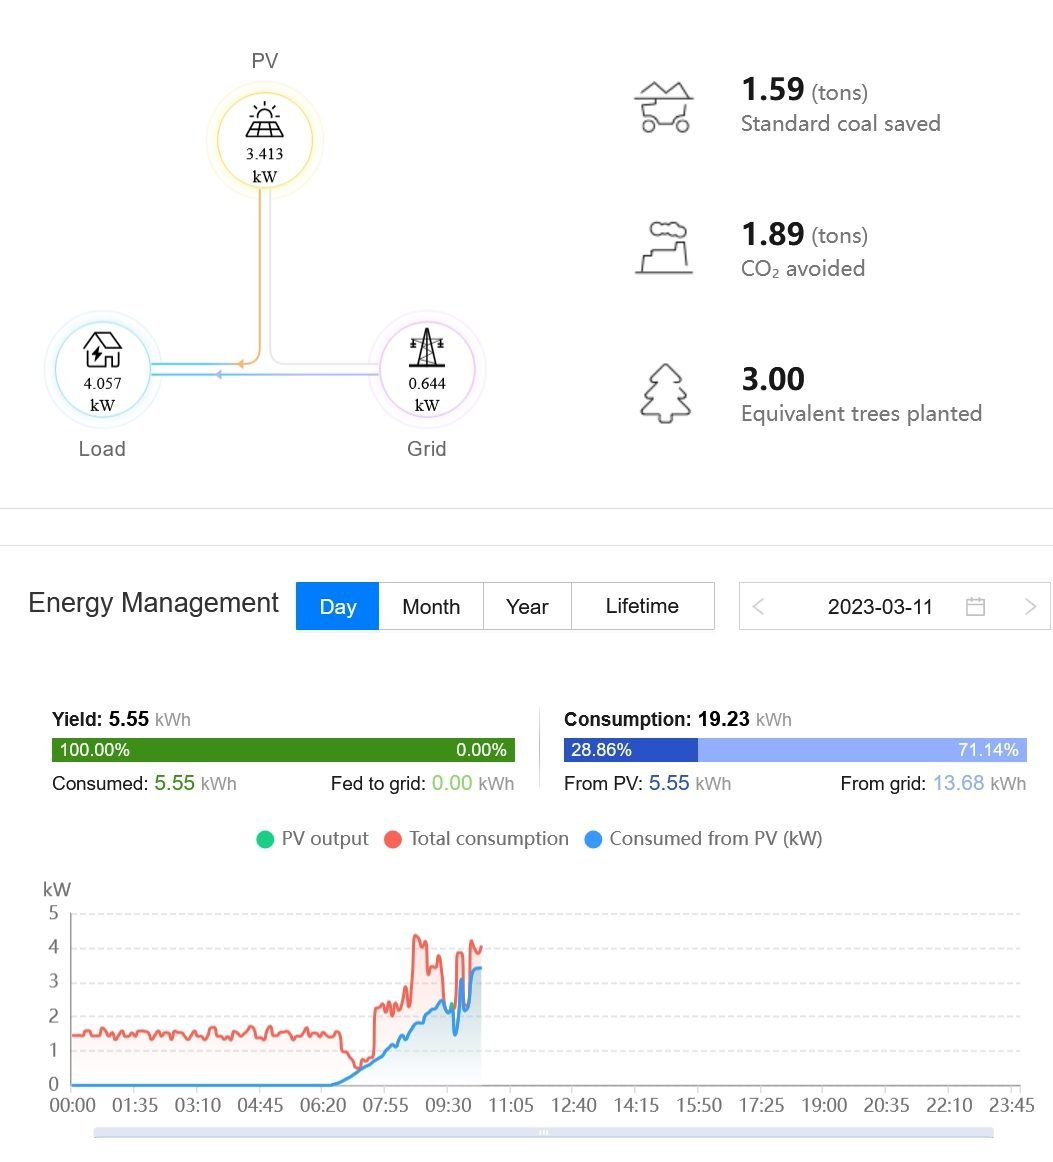
Help understanding power generation and usage
a340bangla1 replied to statman78's topic in Alternative/Renewable Energy Forum
Statman, I seem to be fresh out of ideas. This is what I am seeing this morning: I can associate events in the house with this graph: aircon in bedroom switched off, espresso machine heated up, pool pump started, sprinklers and deep well pump coming on and turning off..... Consumption from PV is reduced when consumers go off. All as it should be. I have turned feed to the grid off for the time being. So I could not imagine what could be wrong in your system. One thing might be worthwhile to try though: You could turn of the feed to the grid for a while and turn it back on after some time to see if this changes anything. KhunLA: Unfortunately, data is going to and stored on the Huawei server, the graph is updated every 5 minutes. Of course, the arrows also show direction of feed, but not in (real) real time. I intensely dislike having my data in China, but what can I do ? This is one thing about Huawei...