

RPCVguy
-
Posts
630 -
Joined
-
Last visited
Content Type
Events
Forums
Downloads
Quizzes
Gallery
Blogs
Posts posted by RPCVguy
-
-
"Remittance Tax - The Senate version was an improvement over the House version as it would not impose the tax on remittance transfers made by banks or bank cards. The final Senate version imposes the tax at 1%, down from 3.5%, a further improvement. The tax will still impact Americans abroad who will not use bank accounts, Credit cards or Debit cards to move money abroad. Although the tax has been lowered is it now not creditable. ACA advocacy has paid off as the Remittance Tax was of deep concern to our organization. ACA will continue to advocate on this issue."
https://www.americansabroad.org/latest_update_on_provisions_in_the_one_big_beautiful_bill_obbb_that_affect_us_citizens_overseas_250701 -
On 6/23/2025 at 5:57 PM, MJoe said:
Y’All, what are we going to do about this? NO ONE who usually has their 7162 form by now, has received it. The forms aren’t still “on the way”. The SSA’s 7162 system is automated. The auto-generated form (specifically barcoded by year), are fed into an automated computer system when they are returned (which retains your payments if the computer reads “your circumstances haven’t changed”). If you don’t return the computer generated barcoded form, the system stops your benefits in February 2026. There isn’t a staff person that is going to manually check any returned paperwork outside their automated system. And clearly the automated system isn’t operating this year. It was hard enough to get reinstated if your benefits get stopped in the past. Now it will be an absolute nightmare to try to get them reinstated.
I had clean photos of my form from 2024 that show the bar coding you discuss. I printed those out, front and back, completed them and signed/dated anew. In the box above the signature I added a comment that the 2025 form never arrived.
New photos and mailed air mail. (68 baht - I too have learned that the registered mail stops at the Wilkes-Barr Postal center. That year I got help from my congressman's office to get a form to SSA.)-
 1
1
-
-
2 hours ago, SLOWHAND225 said:
No it doesn't.
What it does do is require you to be a responsible adult and get that taken care of if you want to vote. Simple to do except for the lazy.
How in the world did that make mail in voting harder ? lol. They have to leave the house 5 days earlier to mail it ? wtfYou chose not to read my post for understanding. With rents rising and many people shifting residences (or tents, or...) the residential addresses for millions of people shift and invalidate voter registrations. Add in the priorities of food, or medical issues and these people will not be allowed to vote. Same for students, off to school or in he military.
The mail in vote issue affects citizens residing overseas or serving in the military. And the birth certificate won't match the name of most married women.
Your confidence in access to information and documents should be the norm, but the reality is not the case.
Voting by non-citizens is a serious crime. Serious enough that even when sought to find examples, the results are rarely there. Certainly too few to shift elections counted in the numbers needed to shift a state's result. -
3 hours ago, CallumWK said:
Any ID obtained before married will be tied to birth certificate, otherwise how would they be able to obtain that ID?
You are making up things much
That is not the interpretation accepted in Texas, and it is meant to become a national concept.
It can be fixed by getting a passport, but that is a 10 year document hassle that most people don't have - because they don't travel. If only used so as to allow women to vote, it is essentially another form of poll tax. (A concept that is unconstitutional.)-
 1
1
-
-
- Popular Post
- Popular Post
6 hours ago, Skunkfarben said:Not birth certificate. National I'd or passport can be ok. Why anybody confusing with this
I have no doubt that if he could, Trump would limit voting to only those he had vetted for loyalty to him. Some past RNC officials have stated such goals as they change voting laws. (They target the poor and students because their addresses are less stable, and hourly workers have financial disincentives to taking time to travel to register. Place those registration locations away from public transport and it is another barrier.) This latest Executive order is an affront to states rights over setting up elections, though at least if done by Congress (a voting rights act) it would have been negotiated in a more constitutional manner. This just seeks to authoritatively reduce eligible voters towards males with money - eliminating swaths of others.
This from the AP:
Millions of Americans don’t have appropriate documents readily available to prove their citizenship even though they are U.S. citizens. For example, in recent town elections in New Hampshire, which recently passed a proof of citizenship requirement, some women didn’t have proper documentation because they had changed their last name when they married. A current idea is to mandate that the name match, which indeed disenfranchises millions of women.
https://apnews.com/article/trump-executive-order-elections-voting-constitution-8908477167fd65dc9cd485e1fde5b804
Additionally, the EO require "all states to reject ballots not received by Election Day, directing the Justice Department to “take all necessary action to enforce” the requirement. The move seemed directly targeted at mail-in heavy states from California to Alaska."
In summary, these steps eliminate many women, and millions of other citizens lacking the current ID, and making mail in voting harder. BTW, it is already hard enough to receive my ballot as a US citizen residing in Thailand within the time frame allotted to mail it back.
-
 2
2
-
 1
1
-
 1
1
-
13 hours ago, Moonlover said:
I don't you think you actually have a problem Sheryl. Did you watch the video I posted on Tuesday? In it the MD of Tax Talk was asked whether those whose remitted assessable income was below the tax threshold need to file a tax return. He stated, quite clearly that they did not And a senior legal officer from TRD did not contradict him! (View the video from about 28 minutes if you don't care to watch it all)
So I guess from that and @NoDisplayName' comment above, you've no need to sweat about it.
THANK YOU!
I had missed seeing this video, but have now not only watched it in its entirety, but have saved the link, and forwarded it to 3 of my Thai family members who (like me) have assessable income BELOW THE THRESHOLD FOR WHICH IT IS EVEN NECESSARY to file a tax return. In my case, that includes not even needing to get a Tax ID#. The absolute advantage of the video is that they can hear the Thai Q&A directly.
I had approached our rural RD office last September, and there was no awareness of DTA exclusions like Social Security.-
 1
1
-
-
7 hours ago, Hawaiian said:
On March 4,2024, the U.S. Supreme Court ruled Colorado cannot ban Trump from the presidential ballot. While specifically naming Colorado it applies to all states.
The Supreme Court sidestepped the issue of the insurrection. Their decision limited a state's ability to keep people off a ballot for national elections such as the presidency. They said only the (hopelessly divided) Congress could exclude someone from being on the ballot. The BBC article you supplied also points to:
QuoteIn issuing its opinion, the nine Supreme Court justices sidestepped some of the biggest political landmines in this case.
They did not opine on whether Mr Trump had, in fact, engaged in insurrection on 6 January 2021. They didn't discuss whether the attack on the US Capitol by the former president's supporters constituted an insurrection at all (or was a riot, as characterised by one of Mr Trump's lawyers).
The court also didn't delve into whether presidents are specifically exempt from the 14th Amendment's insurrection language, another of Mr Trump's legal arguments in challenging the Colorado decision.
https://www.bbc.com/news/world-us-canada-68395816The SCOTUS decision avoided the key elements of the 14th Amendment, already built in. That being a 2/3rds vote by both the House and Senate to absolve the taint of insurrectionist which otherwise would allow such a person to hold office. The 14th Amendment added a disqualification clause to the three qualifications initially listed in Article II, Section 1, Clause 5:
No Person except a natural born Citizen, or a Citizen of the United States, at the time of the Adoption of this Constitution, shall be eligible to the Office of President; neither shall any Person be eligible to that Office who shall not have attained to the Age of thirty five Years, and been fourteen Years a Resident within the United States."
Donald Trump referred to the above constitutional qualification when he said he wasn't worried about Elon Musk becoming president because Musk was born in S. Africa. i.e. he accepts rules and refers to them as authority WHEN IT SERVES HIM.
He had previously tried to disqualify first Obama, then Ted Cruz on such grounds - except they did have requisite document as to their being citizens. He also accepts that elections were fairly conducted - when the results favor him. The CONGRESS CERTIFIED - IN 2021 AND NOW IN 2025, that the elections were properly run and counted, but Trump only acknowledges this one.
The 2024 election proceeded without settling the issue of the 14th Amendment's disqualification clause prohibiting an insurrectionist from holding office. The Federal and state trials were successfully delayed by Trump's attorneys, the election was held and now the legal question remains. Just like age, citizenship and residency, the 14th Amendment separates who is and who is not eligible to be president.
Rules and Laws should matter in a society. The storming of the capitol on Jan 6th, 2021 was by people called to the capitol by Trump, and roused to march on to the capitol by Trump, and aroused further by speeches and Tweets as to actions by Pence. Trump lost that election and evidence presented in the congressional proceedings and court cases since then indicate he conspired in Obstruction of an Official Proceeding; Conspiracy to Defraud the United States; Conspiracy to Make a False Statement and "Incite," "Assist" or "Aid and Comfort" an Insurrection.By the letter of the law, unless and until Congress absolves Trump of his actions, he is not legally eligible to be president.
I again state that I expect the charade to continue. The nation is poised to be run like a circus, with Trump as the ringmaster and the rule of reasoned laws a matter of history. How fast the transition is the question the remains to be seen.
-
1
-
-
2 hours ago, Hawaiian said:
Since when has Congress the power given to the Judiciary. AFAIK, no court has ruled that Donald Trump has committed an act of INSURRECTION or REBELLION.
There was a court ruling atop the initial votes of the House and Senate:
A majority of the Colorado Supreme court held that: "Trump is disqualified from holding the office of president under Section 3 of the 14th Amendment,”
Trump engaged in insurrection, court says: "The top Colorado court upheld the trial judge’s conclusions that the January 6 assault on the US Capitol was an insurrection and that Trump “engaged in” that insurrection. These are key legal hurdles that the challengers needed to clear before Trump could be removed from any ballot, largely because the text of the 14th Amendment doesn’t actually define an “insurrection” or spell out what it means to “engage in” insurrection." https://edition.cnn.com/politics/live-news/colorado-trump-14th-amendment-12-19-23/index.html
Then back to my original post, this was not the only adjudication. The House and Senate each voted by a majority vote to the same offenses. The federal case was successfully stalled from going to trial, but the evidence gathered exceeded what the House Select Committee had the ability to gather.Quoting the 14th Amendment of the US Constitution
Section 3 Disqualification from Holding Office
No person shall be a Senator or Representative in Congress, or elector of President and Vice-President, or hold any office, civil or military, under the United States, or under any State, who, having previously taken an oath, as a member of Congress, or as an officer of the United States, or as a member of any State legislature, or as an executive or judicial officer of any State, to support the Constitution of the United States, shall have engaged in insurrection or rebellion against the same, or given aid or comfort to the enemies thereof. But Congress may by a vote of two-thirds of each House, remove such disability.
The disqualification is real, I've underlined the key words (no mention of conviction) and Americans saw Trump's past and ongoing "support for, comfort to" while putting the remedy Congress can supply in bold print.
Congress is likely to duck their responsibility. My point is that until this is resolved, the ceremony planned for January 20th will be in violation of the law. I don't expect anyone to enforce it. ... A sad day for the rule of law. -
- Popular Post
- Popular Post
35 minutes ago, Yellowtail said:That's hilarious
What is hilarious? The letter of the law as written in the constitution? Or the part where I wrote that "I suspect that Congress will duck their mandated role, just as SCOTUS ducked its role last year."
The election results are in but the ineligibility mars his right to hold office until the constitutional remedy is completed. I suspect that if attempted, a third of the Democrats would go along, just to preserve the peace. Sad days ahead as the dismantling of reasoned systems typically unfolds into chaos, and dismantling is a high priority of those coming into power.-
1
-
2
-
On 1/4/2025 at 12:55 PM, SunnyinBangrak said:
The whole point was to prevent him from becoming President. Now the real jury delivered their landslide verdict on Nov 5th, I suspect this bent judge is just doing this so he can keep the gag orders in place to stop Trump truthbombing on his truth social about the judges bribes by proxy thanks to bringing this nonsensical case.
WILL CONGRESS SUPPLY THE CONSTITUTIONALLY REQUIRED REMEDY?January 6th Election Certification might academically agree that the election was won by DJ Trump, BUT he can not legally be sworn into office UNLESS AND UNTIL both the House and the Senate by a 2/3rds majority vote to remove this disability. (I suspect that Congress will duck their mandated role, just as SCOTUS ducked its role last year.)Consider Trump's own recent acknowledgement of constitutional requirements: "Musk can't be president because he wasn't born in the USA"
By the words of the 14th Amendment, how can someone who supported an insurrection be sworn into office? Even if the election is certified?Note the adjudication so far:♦ The House voted the 2nd impeachment (bipartisan)♦ The Senate voted 57-43 for conviction (bipartisan)♦ The House Select Committee voted unanimously to indict (refer Trump for potential criminal prosecution) DJ Trump for 4 charges: Obstruction of an Official Proceeding; Conspiracy to Defraud the United States; Conspiracy to Make a False Statement and "Incite," "Assist" or "Aid and Comfort" an Insurrection. (bipartisan)♦ Section 3 of the 14th Amendment says candidates are disallowed if they've "engaged in insurrection." Both the Colorado justices and Maine Secretary Bellows said Trump's efforts to overturn the 2020 election, which ended with an attack on the U.S. Capitol, fit that description. Significantly. the Colorado Supreme Court heard an appeal, but upheld that decision.♦ Then the U.S. Supreme Court ruled unanimously that individual states cannot remove former President Donald Trump from their ballots based on the 14th Amendment.
BUT SCOTUS DID NOT RULE ON TRUMP'S ELIGIBILITY TO AGAIN HOLD OFFICE.Of note by former Federal Prosecutor Glenn Kirschner:-
2
-
-
I like the possibilities. I also did not see any link to where and how the use of AI in this instance was verified.
My friends know I have consistently been opposed to AI. This would be an exception where I think it might pay excellent rewards. Might, ... absolutely there are risks.Quote"Government policy processes involve a deep understanding of the political, historical, and social contexts that today’s GenAI models might not fully reflect based on their available training data. Therefore, while GenAI might excel in analyzing and summarizing raw data, we still need human oversight to ensure that those outputs are interpreted correctly.
https://news.broadcom.com/artificial-intelligence/the-promise-and-pitfalls-of-generative-ai-for-legislative-analysis
-
- Popular Post
- Popular Post
In the superseding indictment that became necessary by the way the Supreme Court CHOSE to enter opinions beyond the specifics in question, Jack Smith lost use of the sworn testimony of White House Staffers - but he included testimony of interference by STATE officials, and written documents that incriminate Trump. I'm thinking of communications in seeking to generate alternate electors. That in addition to his calling supporters to DC in a post promising it will be wild.
The arguments Jack Smith presented was deemed sufficient to NOT throw out the charges that Trump's lawyers sought to have dropped. Bottom line is this decision by Judge Chutkan to allow a jury to decide whether or not guilt is established. That is all that was determined here.
The only case that Trump's lawyers have not managed to delay beyond the election found him guilty of 34 counts of criminal fraud. Sentencing was delayed until late November, after the election.
For those keeping score, the odds of a trial eventually getting a guilty verdict on the January 6th case in DC gained testimony yesterday from Trump himself. He repeatedly used the word "WE" in reference to those who stormed the capitol, and that video will be admissible in court.-
3
-
1
-
1
-
2
-
On 7/14/2024 at 1:28 PM, sometimewoodworker said:
A ridiculous request as there are 61 different DTAs
No. The Thai RD says they want all income listed. IF they stick by that demand, there are things our embassies would be remiss not to pressure for:
Step one would be to change the top line from saying "assessable Income" meaning subject to being taxed. All Income sources is what that line must be changed to state.
Then there needs to be a line declaring the amount not taxable and state the person's nationality as to which DTA is being used.
The TRD has the option to then audit or not.
This process is NOT what I would want to do, but it at least puts clerks at the TRD on notice that there are a large number of exemptions that Thailand agreed to... and did so to entice thousands of expats to move here and spend foreign earned currency in the country over months and years. It sure helped during the COVID pandemic to have that regular cash flow as trade struggled.
The good news should be that if someone makes it through their first audit (if ever required) the topics and line items for most expats will be the same each year.
-
37 minutes ago, Mike Lister said:
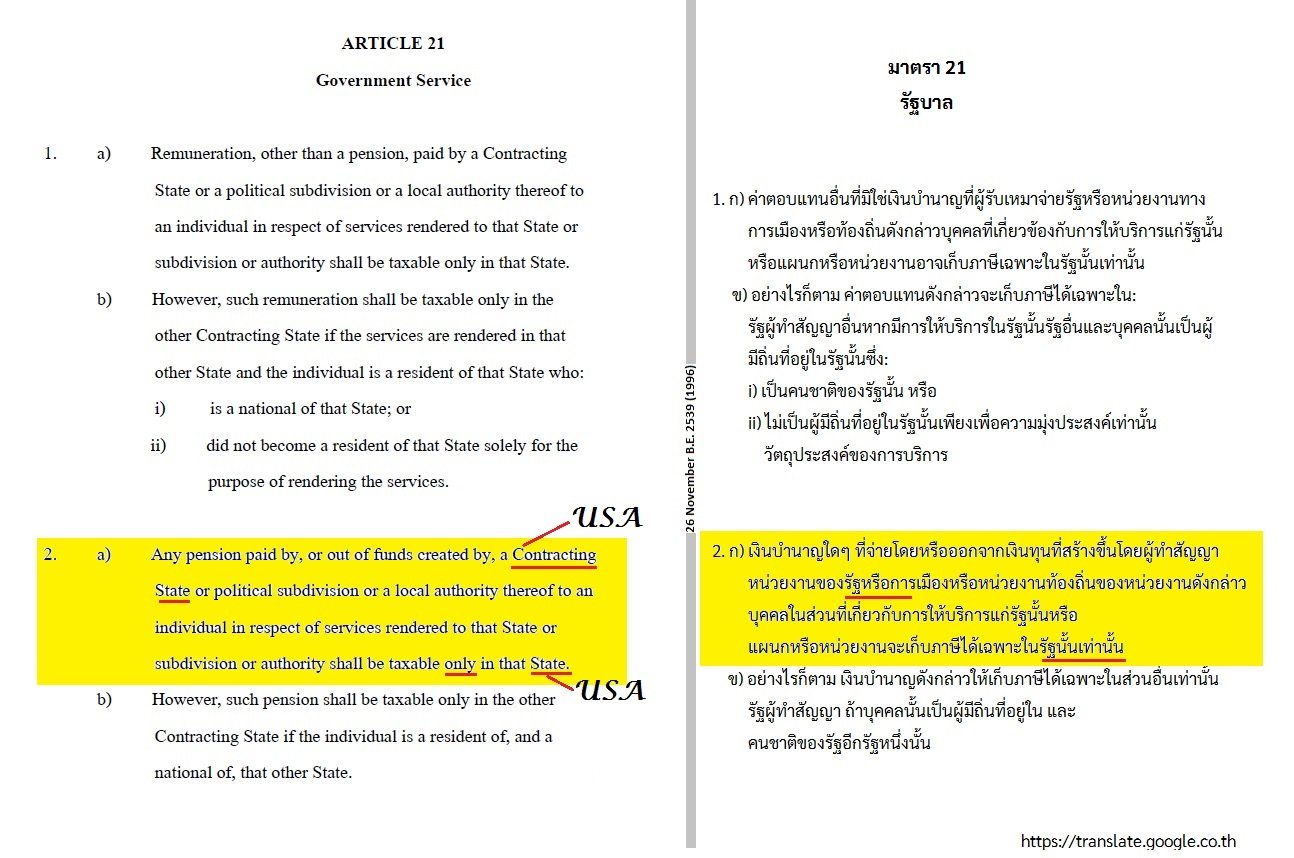
There is a link in the document in the OP that will let you download your DTA in English.
Also, US SSc is exempt, under DTA rules.
Yes, that is what I used to access the DTA. The left side of those 2 images are screen captures from the DTA between Thailand and the USA. The right side is a Google Translation of the same text into Thai, printed side by side to show the local TRD officer if asked to explain my bank cash flow vs what will be listed on the tax filing.
ALL of this discussion for me and many others would not be necessary if the Tax forms are revised to account for DTA exemptions from tax assessability/ consideration.-
1
-
-
43 minutes ago, Mike Lister said:
There is currently no need to declare non assessable income, although that may change towards the end of this year as the new tax forms are redesigned and released for use (we understand they will be available in November). Typically in the past, Social Security income for example, was simply left off the the tax form and not declared at all (I didn't declare mine and the TRD has been happy with that).
So simply ignore the non-assessible amounts, unless there are new forms for 2024 that allow for the declaration and then elimination of those amounts.
Meanwhile, I used Google Translate and generated these two portions of the USA/Thai DTA as images to print and show to TRD if they ask for details.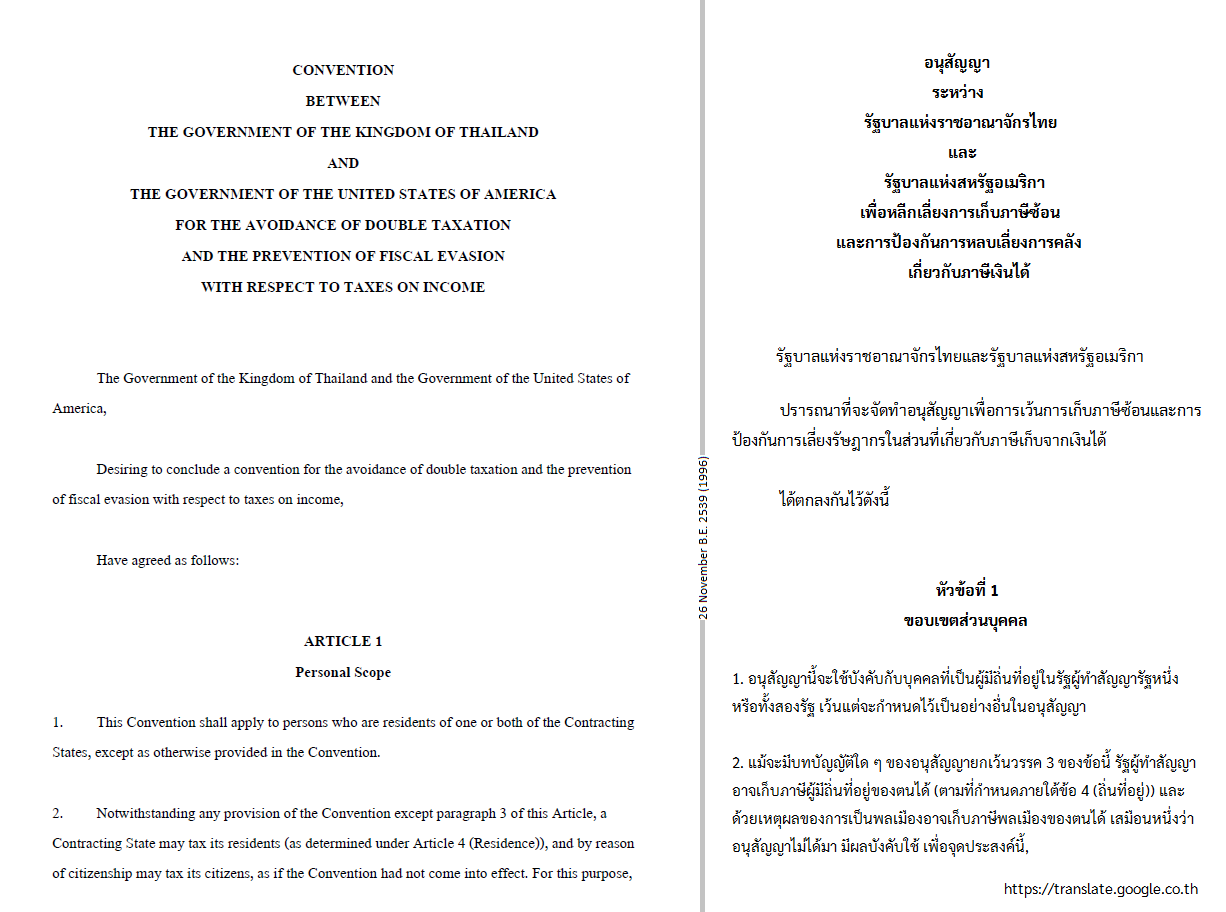
__________________________________________________________________________________
-
1
-
-
- Popular Post
- Popular Post
On 5/21/2024 at 8:02 PM, Mike Lister said:There is no place on the current form to put that information because it means invoking the DTA. We're waiting to see what the new tax form looks like in the hope it will yield some clues about what is required.
Mike, along with many others here, a huge THANK YOU for your post and many responses.
Like a few others here, my situation should be simple, BUT there is no way to both list non-assessible and then deduct it from further consideration. 75% of my annual income is from US Social Security. 25% is split evenly between a federal pension and an annuity from a corporate pension plan. (Oh, and a few hundred Baht is withheld annually by the Thai Bank for my mandated deposit as someone married to a Thai.) Under the DTA, only the corporate pension and Thai bank interest is assessible, and it is well below the 120,000 baht level - even this year with exchange rates high for the US Dollar.
Retired here 17 years, except for a few hundred (mostly Life insurance) ALL COMES INTO THAILAND and shows up in my bank accounts.
TRD wants it all listed.
I (and many others) need a way to account on tax form for DTA funds brought into Thailand.
A Thai friend in Bangkok got nowhere further than being pointed to the current forms 90 and 91. She was told not to expect any changes to the forms for 2024.
On Tuesday July 9th I also contacted the US Embassy asking about any potential changes to the DTA with Thailand. The reply:QuoteYes, we understand that there is a great deal of anxiety among U.S. retirees here concerning possible changes.
Thailand has made no approach, up until now, to the U.S. Government to renegotiate its tax treaty.
At this point, while we have asked the Thai Government for clarification, we have not received any specific information as to how this might affect U.S. citizens, if at all.-
1
-
2
-
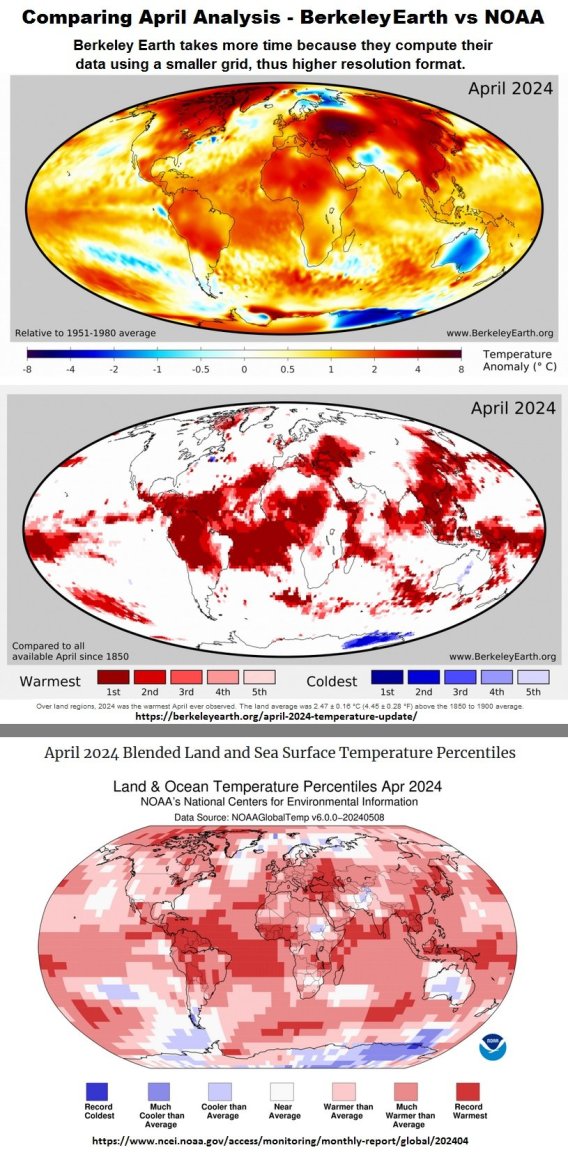
I notice that the NOAA image above loads very slowly for now, the site likely very busy.
The Berkeley Earth site published their April Analysis today. As I've noted, their site is consistently the most details in number and quality of reporting.
This time, instead of linking to the site from its source, I have loaded the images to this post.
-
On 5/6/2024 at 7:19 PM, RPCVguy said:
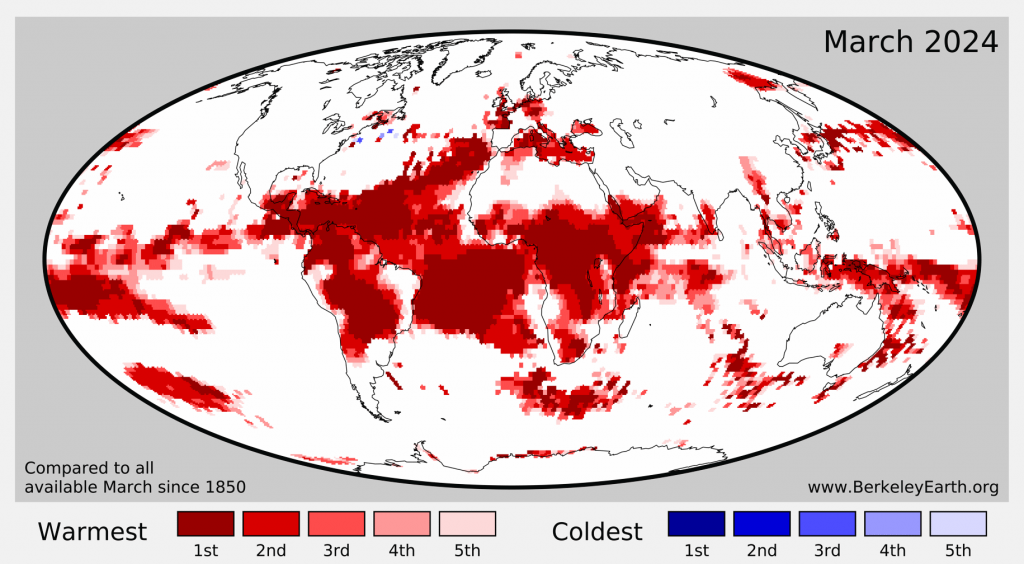
Earlier I commented that the monthly analysis for April from Berkeley Earth would not be out until mid May. This one is lower resolution, but it gives the broad stroke review comparing this April for prior Aprils. the caption with it, posted in a group for Climate Alerts, reads:
"April 2024 easily beat the record for warmest April. A staggering 21% of the globe had their warmest April since 1940. Even when you exclude the oceans, April 2024 over land was also the warmest on record."
Brian Bordtschneider
When a higher resolution mapping becomes available, I expect to see splashes of coloring for 2nd or 3rd warmest appearing throughout, but the dominant regional trend for SE Asia is that this was the warmest April on record. That does not mean every day was the warmest, but it means the temperatures and time at those elevated temperatures per day are generally setting this April as the warmest on record.

I posted earlier the above mapping from the European site. Yet, the debate continued. 😲
It is good that people care enough to track, but many comments were based on limited data, maybe from a single location.
IT IS GREAT THAT THE RAINS HAVE ARRIVED in amounts sufficient to soak up and relieve the heat as the water evaporated.
If they are not yet sufficient in some areas, then the light rains make it feel like pouring some water on the rocks of a sauna.
Meanwhile, NOAA has released its report as to April. It is indeed a higher resolution than my earlier post. It explicitly shows most of the grid for Thailand was at record high heat, with a patch of the North West (into Myanmar) that was not quite setting a record. (2019 holds the record there.) The map below is one of several at:
https://www.ncei.noaa.gov/access/monitoring/monthly-report/global/202404

Of note in the report by NOAA is this quote, using a word much argued in this and related threads.
"Record warm April temperatures in Southeast Asia were due in part to a heatwave in late April with daily high temperatures exceeding 38-43°C (100-110°F) in an area stretching from India to southeastern China and the Philippines. "-
1
-
-
Earlier I commented that the monthly analysis for April from Berkeley Earth would not be out until mid May. This one is lower resolution, but it gives the broad stroke review comparing this April for prior Aprils. the caption with it, posted in a group for Climate Alerts, reads:
"April 2024 easily beat the record for warmest April. A staggering 21% of the globe had their warmest April since 1940. Even when you exclude the oceans, April 2024 over land was also the warmest on record."
Brian Bordtschneider
When a higher resolution mapping becomes available, I expect to see splashes of coloring for 2nd or 3rd warmest appearing throughout, but the dominant regional trend for SE Asia is that this was the warmest April on record. That does not mean every day was the warmest, but it means the temperatures and time at those elevated temperatures per day are generally setting this April as the warmest on record.
-
1
-
-
1 hour ago, radiochaser said:
What have the temperatures been in Thailand lately? Saying it's hot doesn't mean much without some perspective, such as a report on measured temperatures. It's been hotter lately where I live, but it's normal temperatures for this time of the year, going up into the mid 80 deg F.! And there will be hotter days to come.
This was asked and answered in another thread - specifically for Bangkok when I posted at
•Then, to take a top down look at all of Thailand as to whether this year has been warmer or similar to historical averages, we are still days away from the release of April's date, but here is a map of January through March, and Thailand has been warmer than average.
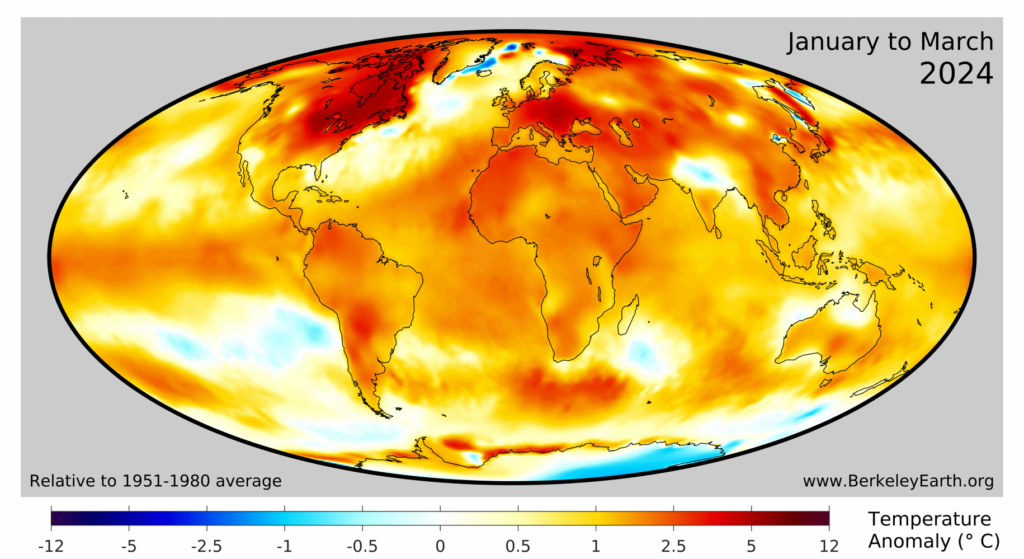
Global surface temperature anomalies for the first three months of 2024 compared to a 1951-80 baseline period. Figure from Berkeley Earth.
While all of Thailand was warmer than average in March, only portions of Thailand averaged the month as one of the top 5 hottest months ever. This is an example of the map that will be released sometime around mid-May for April.
-
1
-
1
-
-
16 hours ago, TallGuyJohninBKK said:
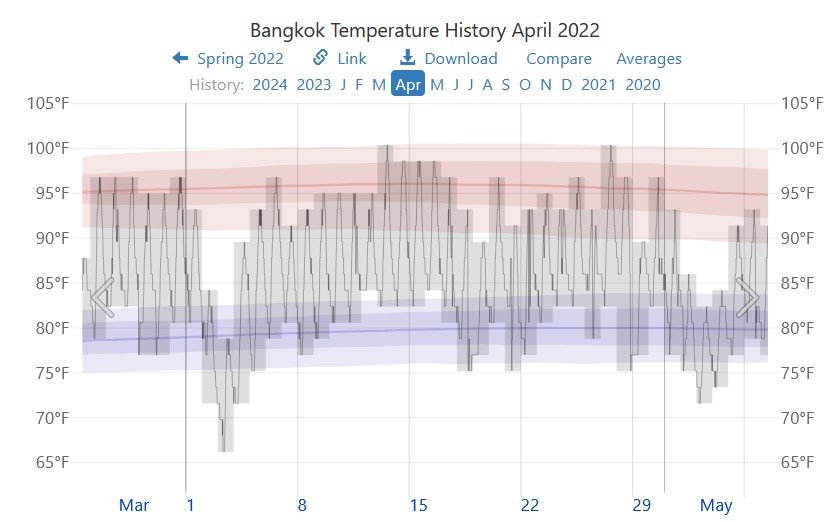
I have an Amazon Alexa device at home that gives me current temperatures for Bangkok in real time every day. That's been showing daily highs illustrated by the gray bar peaks right around 100 F., sometimes a bit above, sometimes a bit below, for many days now. And the below chart seems to confirm that.
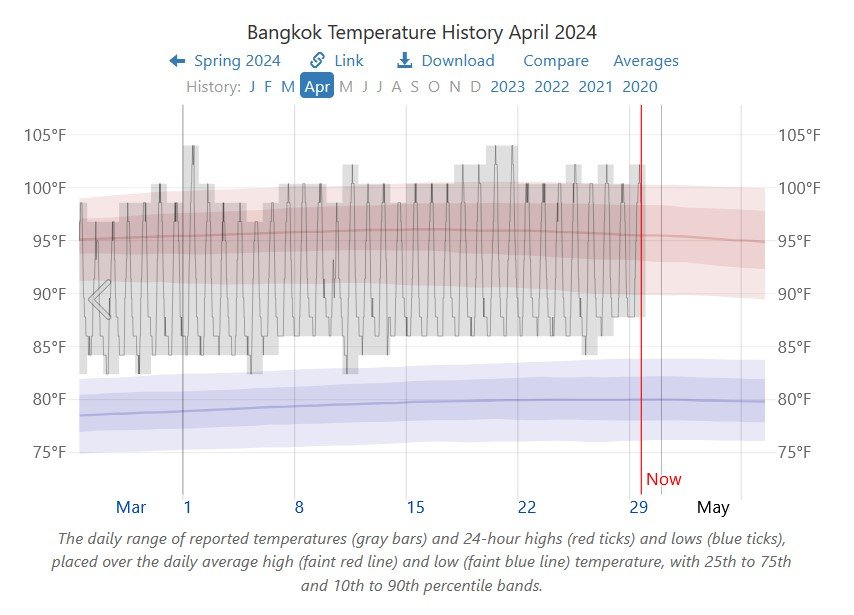
Seems as though past years in April, as illustrated by the peaks of the gray shaded bars, have been quite a bit cooler, though 2023 was warming up:

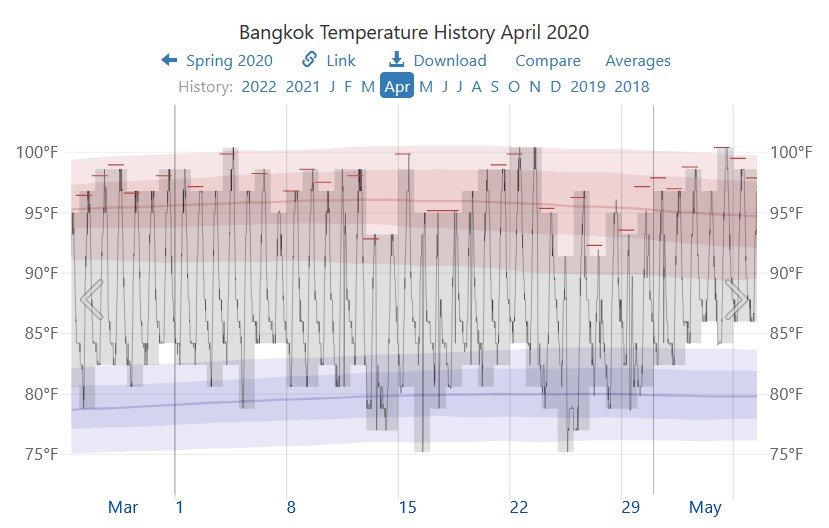
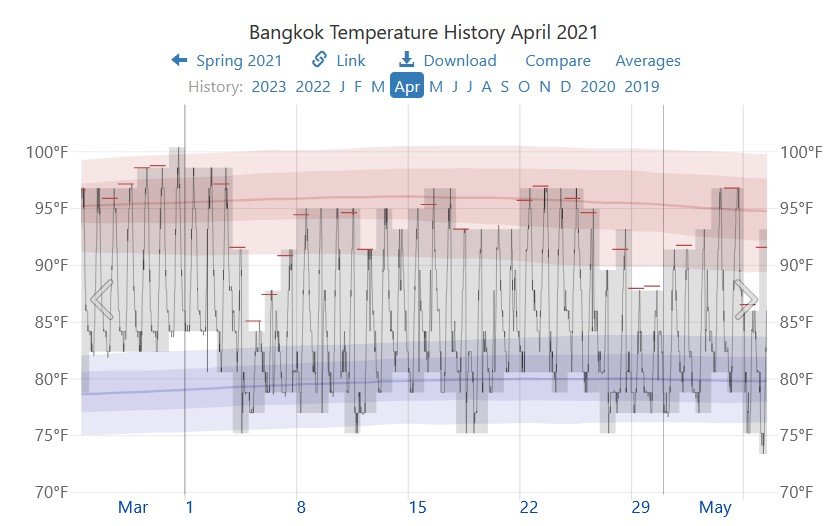
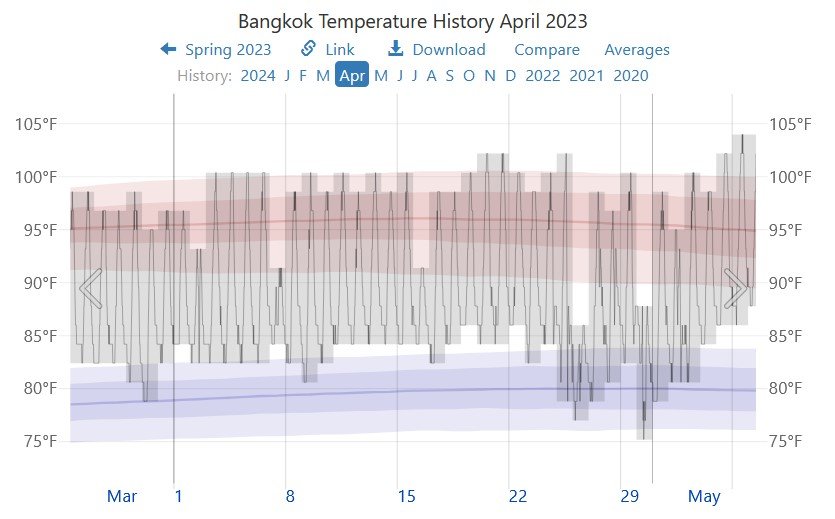 15 hours ago, KhunLA said:
And yet, they look almost identical to me ...

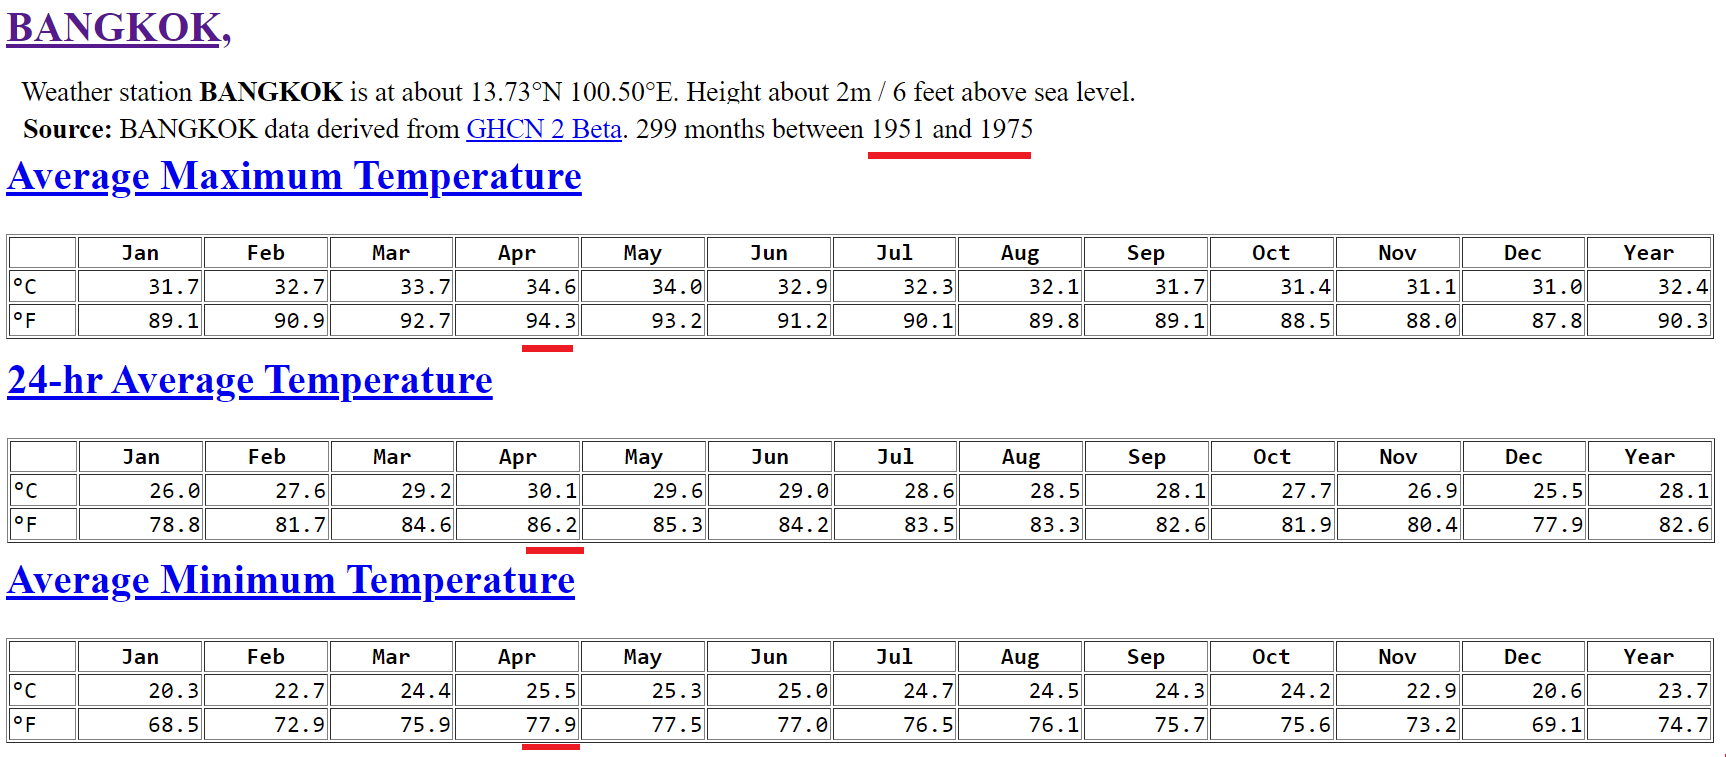
Nor has the average high changed in 40-70 years, all of 0.7°F
You do have to consider, there's a lot more concrete and buildings, holding and radiating temps, so without those, and ambient air, might even be less.
Maybe do comparison elsewhere in TH, that hasn't changed as much.
Two posts with excellent detail to which I've extracted and commented upon why and how I see the comparisons need to be made.
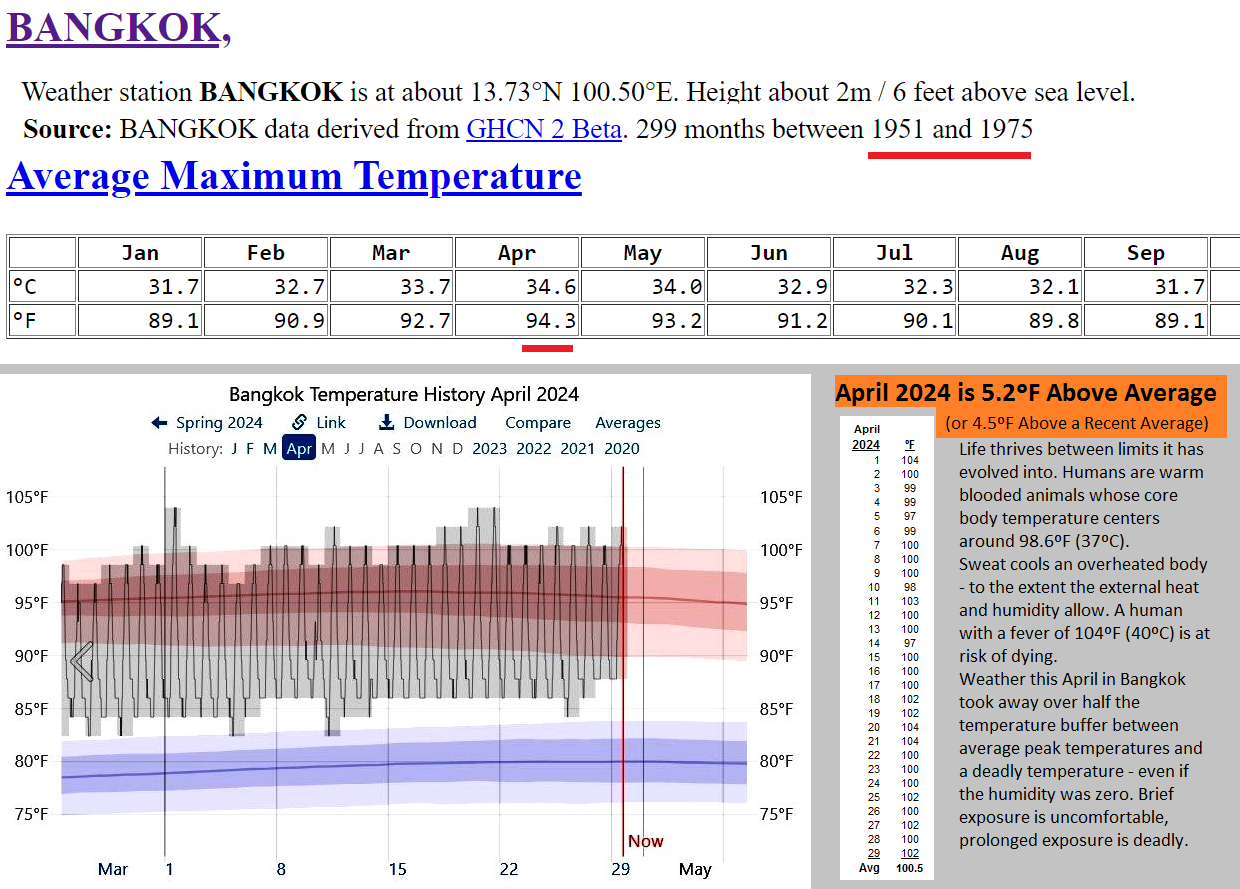
The historical averages are increasing. they do so less rapidly near the coast than they do inland. Averages matter, but it is the peak temperatures in the tropics that stress the ability of humans to survive outside (or indoors if the power cuts off.)
The remnants of the El Niño that started last June are what are forecast to continue bothering SE Asia through most of May. If you have access to and are using air conditioning to modify your situation, enjoy it and appreciate its assistance. Many, many people in Thailand do not.
-
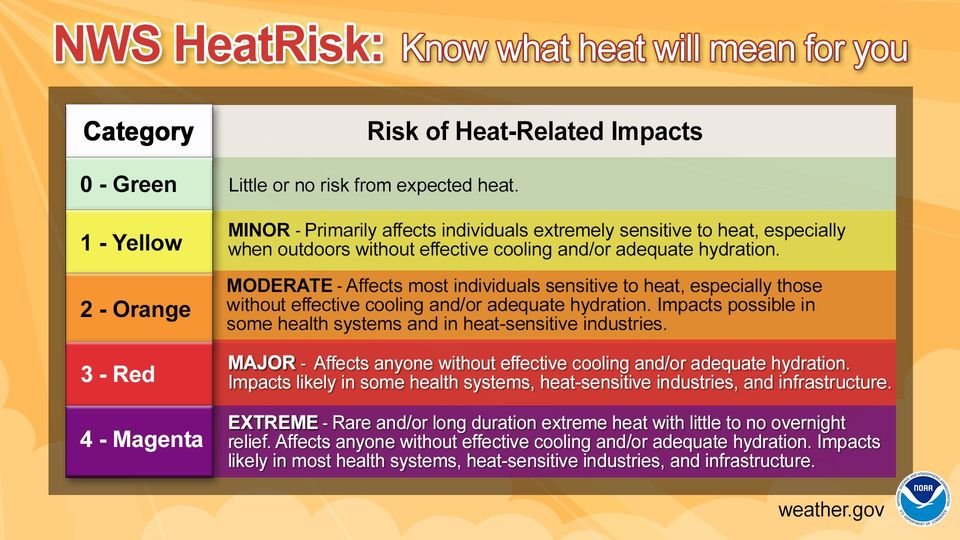
Interesting. This fits my desire to express warnings while satisfying the desire to avoid the term Eat Wave.
The USA National Weather Service has posted an experimental coding for something they are labeling HeatRisk.
Unlike their chart of Heat Index, which calculates a number based upon Heat & Humidity or even the Misery Index that includes Wind Chill into the Heat Index, The HeatRisk takes into consideration:- How unusual the heat is for the time of the year
- The duration of the heat including both daytime and nighttime temperatures
- If those temperatures pose an elevated risk of heat-related impacts based on data from the CDC
Although I do not have access to anywhere near the amount of localized temperature and humidity data to begin to map Thailand's current situation, I suspect that the duration of elevated temperatures experienced this month in Thailand would be sufficient to apply the level 4 Magenta designation to them.
Unlike Heat Wave, which term has a definition of a specific number of degrees for a specific number of days, this designation can and does vary daily as is demonstrated in the mapping of the USA on different days this week as seen under the sub-menu for maps at:
https://www.wpc.ncep.noaa.gov/heatrisk/
-
19 hours ago, dinsdale said:
I see lots of confused emojis to my quoted post. I suggest those who are confused look up the definition of what a heatwave actually is. What we are experiencing is not a heatwave within the definition. What it is is continuous highs at the higher end of April maximum temperatures. This is the unusual part. Maximums are not unusually high for April.
I'm not one who has posted such emojis on your post. The definition of a heat wave was maybe created (in Europe and North America) to cover situations that are dangerous to the health of many people. Temperatures in those regions vary more widely than in the tropics. The tropics are both more consistent in temperatures and simply closer to the limits of what humans can tolerate metabolically. A true "Heat Wave" in the tropics would be physically far more dangerous to life than one in temperate climate zones.
I agree on what the current definition is for heat wave, but there is not currently a suitable English word for the Heat Index Danger Zone now being experienced daily over a wide region of SE Asia.
The Link I provided in my above comment, with images refines the standard HEAT INDEX by including Wind Chill.
That site calls their index a MISERY INDEX.
People can access the menu for making the site interactive by clicking the word "earth" at the bottom left. The advantage of the site is that it accesses satellite weather data and presents it as a map, easy to understand.
I only wish the colors in the grid at the right (by Berkeley Earth) and the colors of the map matched. What is Amber on the map is in the light red in the grid. The reason so many people are agreeing with the discomfort of this month is that the FEELS LIKE temperature and humidity has been persistently high for the month... I see since April 3rd.
Because the humidity will rise faster than temperatures will drop as the monsoon rains begin, we can expect that the danger zone conditions will migrate towards extreme danger conditions. Things will then cool down as sufficient rain absorbs the excess heat now stored in roadways and building structures.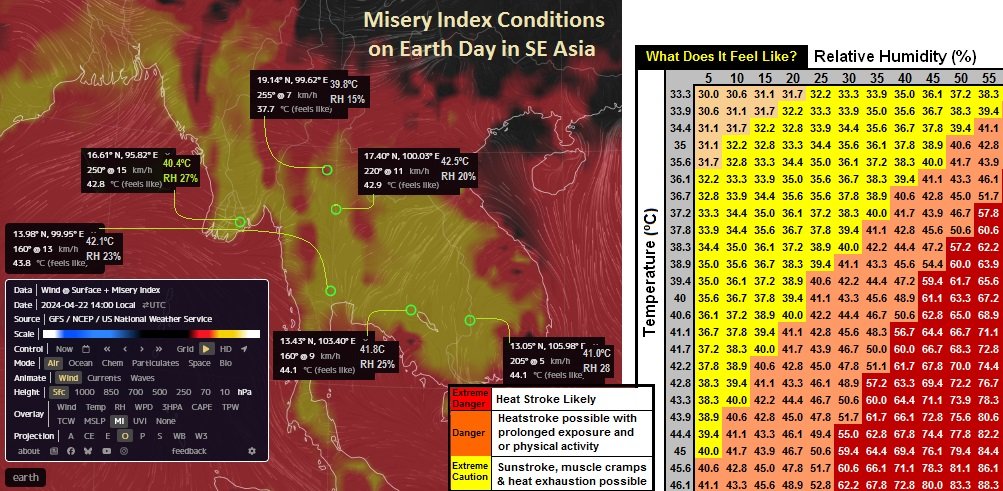
-
21 hours ago, dinsdale said:
Daily temperatures for Thailand in April usually range between mid 30°C to low 40°C maximums and high 20°'s for overnight minimums depending where you are. Average daily temperature is what it says, an average of both maximum and minimum temps. The average max for the next ten days where I am including today is 38.9°C with 29°C being the average overnight minimum. So no heatwave just continuous heat. Having said this I would think this year April will go down as one of, if not the, hottest on record. Doesn't make it a heatwave though as maximums and minimums are not unusually hot it's just continuous.
The WMO definition of a heatwave may need to be reconsidered. Those writing the definition might have shown a bias due to living in temperate latitudes. 2 Billion people live in the tropics where the temperatures are consistently closer to the ceiling defined by metabolic limits. People with a disease die when they sustain a fever of 40ºC/ 104°F. That is the same thermal limit if heat and humidity combine to inhibit cooling via sweating. Heat stroke occurs when their core body temperatures rise from environmental heat.
21 hours ago, jonclark said:Just because you haven't experienced or seen what you define as a heatwave, doesn't me other people and parts of thailand have shared that experienced. My in laws who live 20km outside of Kanchanaburi have had to up sticks and move in with us as they simply could not bear the heat any longer and have had temperatures of 40+ for many, many days. And they have been in Thailand far longer than you or I being in their late 60's. They usually take the piss out of me as I am on the one complaining of the heat - nice to turn the tables for once.
When we parked up to collect them and returned to the car an hour or so later - the temp in the car was a whopping 53 (obviously it a car and metal so conducts heat) but still I have rarely seen my car thermometer register anything above 40.
Splitting hairs as to if this is a heatwave of not, simply ignores the fact that is it very hot. End of. And on that everyone agrees.
Our home is 2-stories, with the AC upstairs. Unfortunately, this year there are signs of a wiring problem in our attic - that no one dare go into to explore/fix. I'm about to go downstairs - again. It is sufficiently cooler to be tolerable while doing nothing beyond reading. We have the following report that came out, sadly pointing to SE Asia as the region most at risk of continued heat through the end of May as reported in this paper:
"The tropics, characterized by high temperatures and humidities, face heightened risks from heat-related impacts (Parkes et al., 2022; Raymond et al., 2020, 2021; Sherwood & Huber, 2010). This vulnerability is exacerbated by the consistent warming trend, leading to more frequent and intense heat events."
https://agupubs.onlinelibrary.wiley.com/doi/10.1029/2023GL106990
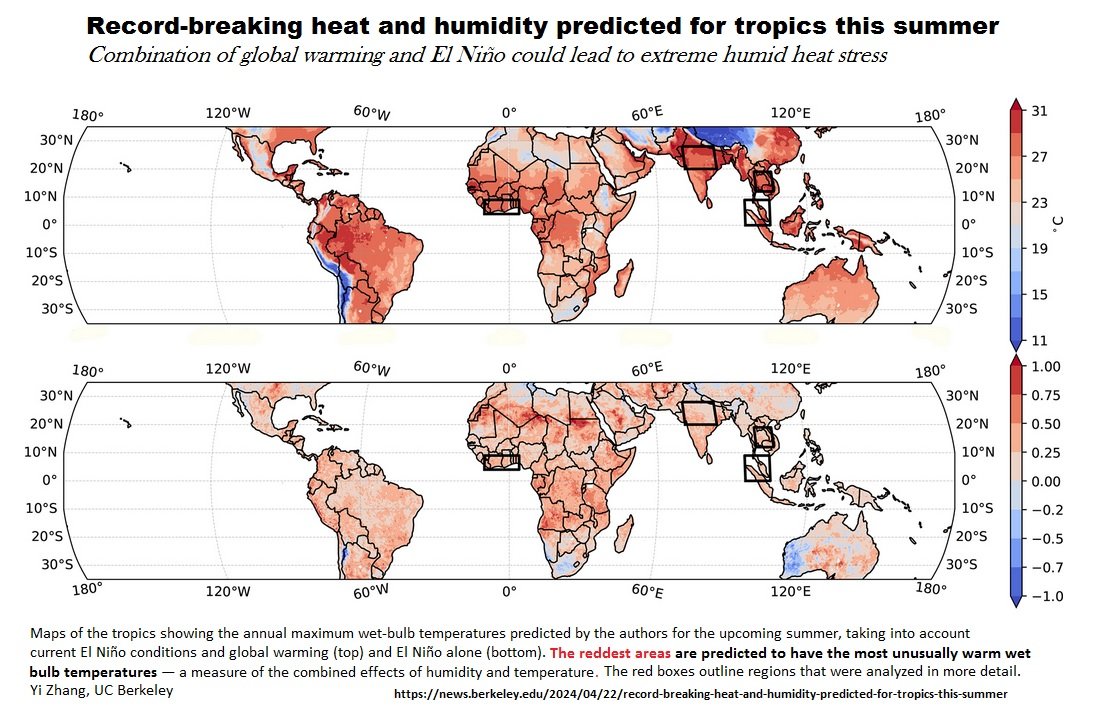
Then looking at the actual conditions across SE Asia on Earth Day where areas in amber equate to 40ºC or higher, thus in the danger zone. The conditions have been persistently the same since April 3rd. Misery Index (Heat Index discounted for wind chill) is mapped and posted in an interactive manner using weather data from EMC / NCEP / NWS / NOAA

U.S. 3.5 percent tax on remittance transfers is still in the Senate version of big bill
in US & Canada Topics and Events
Posted
Yes, as the bill is for now, that's how I read it will apply to Wise.