
RPCVguy
-
Posts
630 -
Joined
-
Last visited
Content Type
Events
Forums
Downloads
Quizzes
Gallery
Blogs
Everything posted by RPCVguy
-

Bangkok scorched at 38°C with thunderstorms looming
RPCVguy replied to webfact's topic in Thailand News
The first couple of minutes of this PBS video explains Wet Bulb, and a demonstration of how it is roughly measured. -
Bangkok scorched at 38°C with thunderstorms looming
RPCVguy replied to webfact's topic in Thailand News
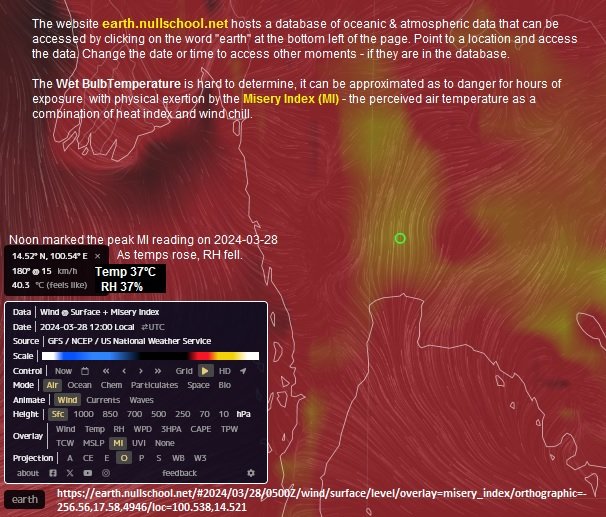
Yes, that is a good site for basic data and a forecast too. Another site supplies historical detail and compares it to the typical temperatures for that day. So far, Bangkok is warmer than average this year. Take a look at the temperature measurement vs the thin red line that tracks the historical average temperatures as recorded at • https://weatherspark.com/h/y/113416/2024/Historical-Weather-during-2024-in-Bangkok-Thailand The data collected on the above site agrees well with the Weather DataGFS (Global Forecast System) assembled from EMC / NCEP / NWS / NOAA and posted on https://earth.nullschool.net/ The site can be set for a specific "home" GPS setting and will provide a few days forecast. Locations that are not on weatherspark.com list of sites may have reporting, but I have found the data to be unreliable as to reporting relative humidity. Maybe their equipment is poor, or the equipment is not well placed. People reporting 55% humidity while stating the temperature is over 35ºC might be accessing such sites. Alternatively, the conditions are short term. Such readings are in the range that can not be endured for long. Looking at Thailand for March 28th, such conditions were NOT seen. One of the worst readings was 37ºC with 37% relative humidity.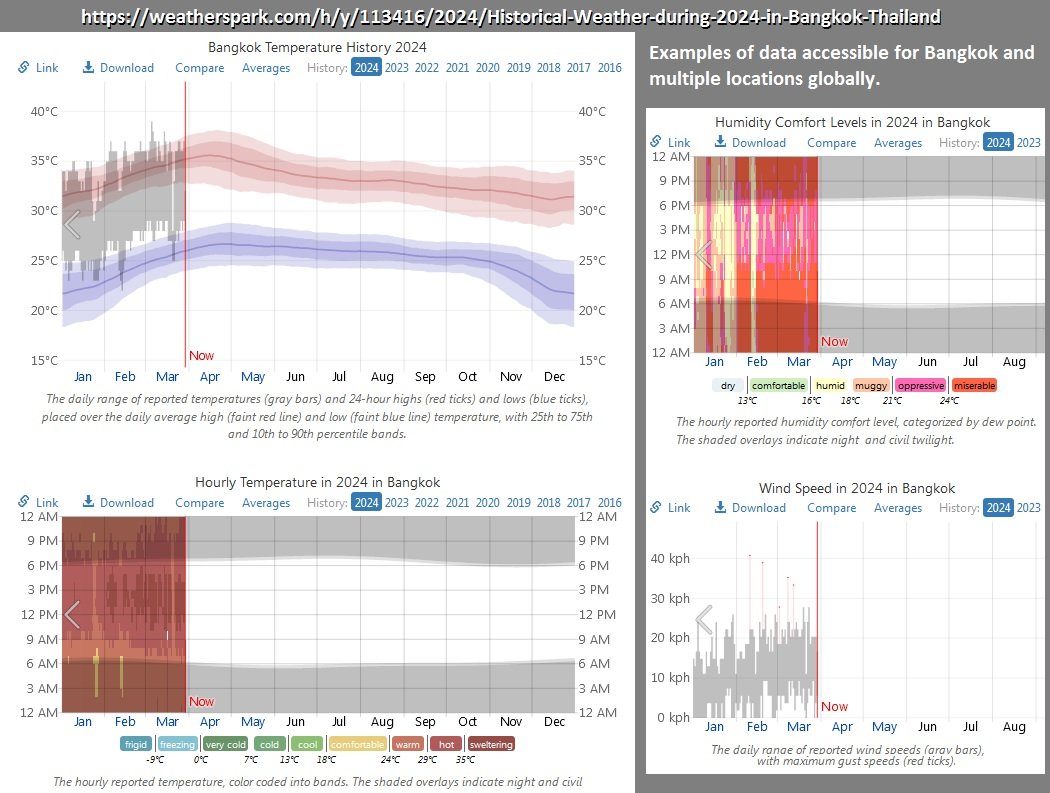
-
That's just another aspect of geophysics relating to glacial ice melt. It is not related to the latitude but rather to the specific mountains or land mass that is losing glacial ice. Post-glacial rebound or isostatic adjustment is the rise of land masses that were depressed by the huge weight of ice sheets during the last ice age.
-
The headline got people to look, the reality is not soon so significant. Actually, the climate consequences are delaying a reverse negative leap second from 2026 to maybe 2029. • https://www.msn.com/en-xl/news/other/melting-polar-ice-may-be-slowing-earth-s-spin-and-messing-with-how-we-measure-time/ar-BB1kHsvu What is happening is that the mass of ice at the poles that melts ends up becoming part of the water bulge of oceans at the equator. Just like a figure skater can slow a spin by extending arms outward, the added mass at the equator means the Earth spins slightly slower. But the changes at Earth's core was causing a speeding up of the rotation. The definition of a day being 24 hours of 60 minutes, each having 60 seconds has already been replaced by using the adoption of atomic clocks in 1967. That change of time measurement revolutionized timekeeping, relying on the precise frequency of atoms for accurate measurements. People who are responsible for posting the time nationally will track the topic, come to an agreement and reset their clocks in the year needed, subsequent radio and communications systems will follow along, and most people will never notice.
-
Thailand grapples with scorching heat and sporadic thunderstorms
RPCVguy replied to webfact's topic in Thailand News
Not quite. Each cycle of El Nino gets hotter. For the tropics in general, and Thailand in particular, temperatures peak during both the spring and autumn equinox. As the planet warms, the oceans warm, and those seasonal temperature peaks also increase on average. https://climatereanalyzer.org/clim/t2_daily/?dm_id=tropics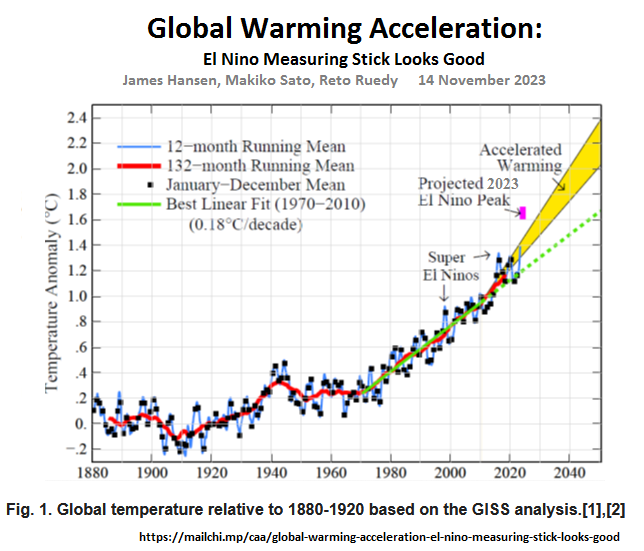
-
Thailand grapples with scorching heat and sporadic thunderstorms
RPCVguy replied to webfact's topic in Thailand News
It is the heat of the season, combined with high enough humidity to make it feel even hotter. Today, the actual temperature of 37.5ºC feels like 40.2ºC https://earth.nullschool.net/#2024/03/25/0600Z/wind/surface/level/overlay=misery_index/orthographic=-256.68,22.35,1823/loc=100.707,14.146 The ongoing warming of the seas add to humidity and pre-warm the air more - before it reaches shore. It will make this El Nino hot season hotter than those of the past. Future cycles will get still worse. Here is a graph tracking ocean temperatures https://climatereanalyzer.org/clim/sst_daily/ Air over the tropics peaks during both the spring and autumn equinox. As the oceans warm, those seasonal peaks also increase on average. https://climatereanalyzer.org/clim/t2_daily/?dm_id=tropics -
Thailand braces for intense heat with temperatures soaring
RPCVguy replied to webfact's topic in Thailand News
Daily measurements on hundreds of locations globally, gathered over 50 years and averaged gave a DEFINED baseline that the IPCC nations agreed (in 2015) to use as the pre-industrial starting point. Very refined instrumentation since then has allowed agencies to measure the current AVERAGE to a level of precision. If you look at the graphics in my post above at https://aseannow.com/topic/1320365-thailand-braces-for-intense-heat-with-temperatures-soaring/?do=findComment&comment=18708900 Pay attention to how closely the different, independent agencies numbers have agreed over the last 50 years. Then too, look at: https://aseannow.com/topic/1319433-first-time-the-world-has-exceeded-15c-for-an-entire-year/?do=findComment&comment=18698506 You will see some lines have a shaded range showing the degree of uncertainty in that researcher or agency's numbers. -
Thailand braces for intense heat with temperatures soaring
RPCVguy replied to webfact's topic in Thailand News
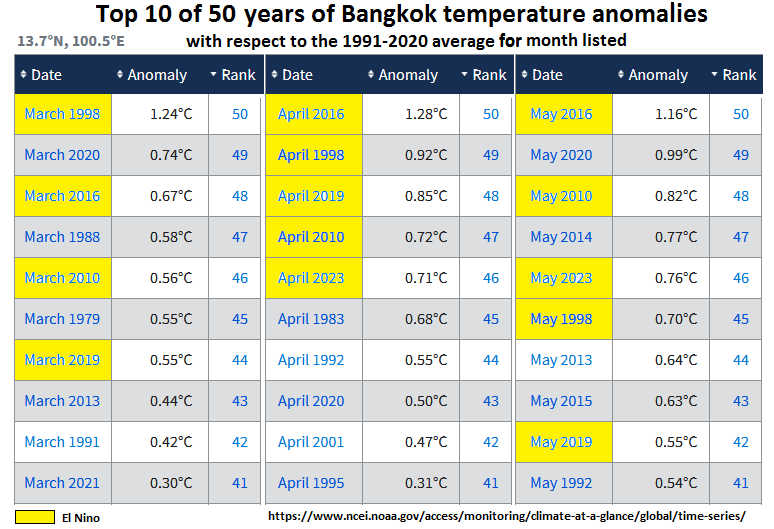
Here is a Bangkok specific reply as to the effect El Nino has on the history of heat during March, April and May. The peak temperature for El Nino globally is generally in February of the year after the El Nino started. Temperatures are rising globally, so recent La Nina years have averaged higher than El Nino years of even a decade ago. 2024 is when the peak temperatures for this El Nino cycle are expected. These charts and tables show monthly averages compared to 30 years of averages for the same months from 1991-2020. I highlighted the El Nino months to call attention to why this 2024 season from March through May has a high likelihood of being uncomfortably hot.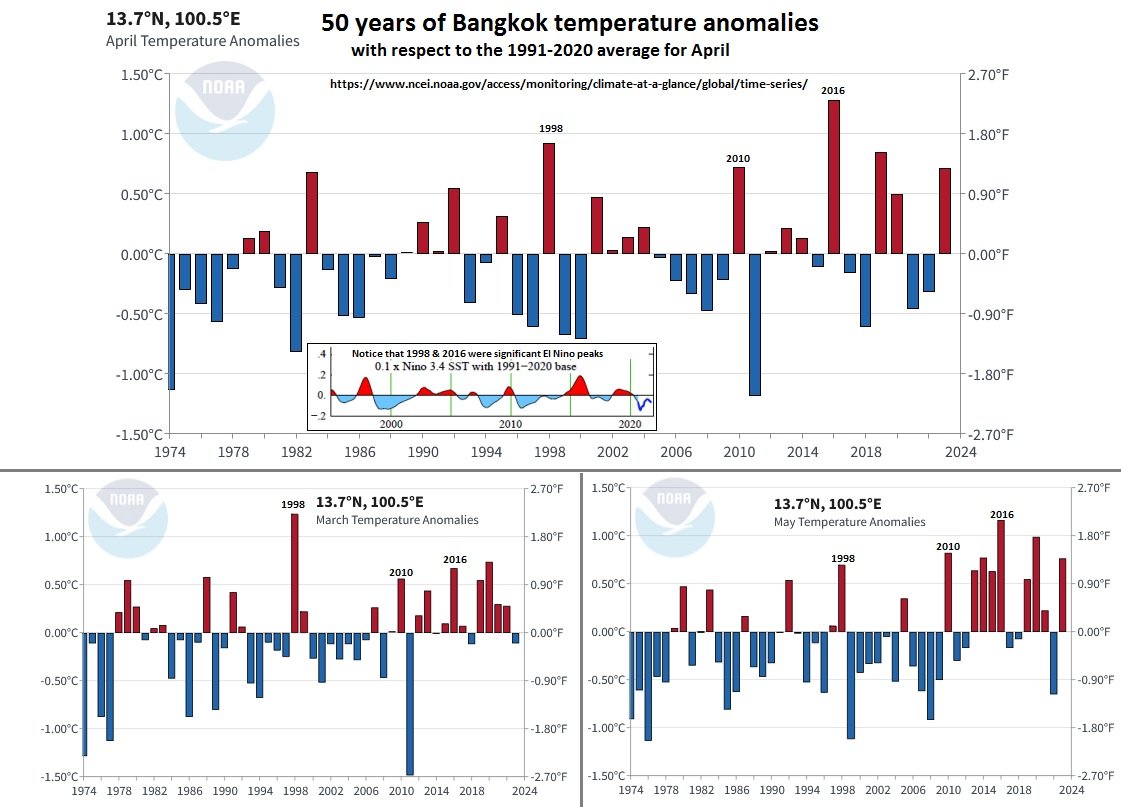
-
Thailand braces for intense heat with temperatures soaring
RPCVguy replied to webfact's topic in Thailand News
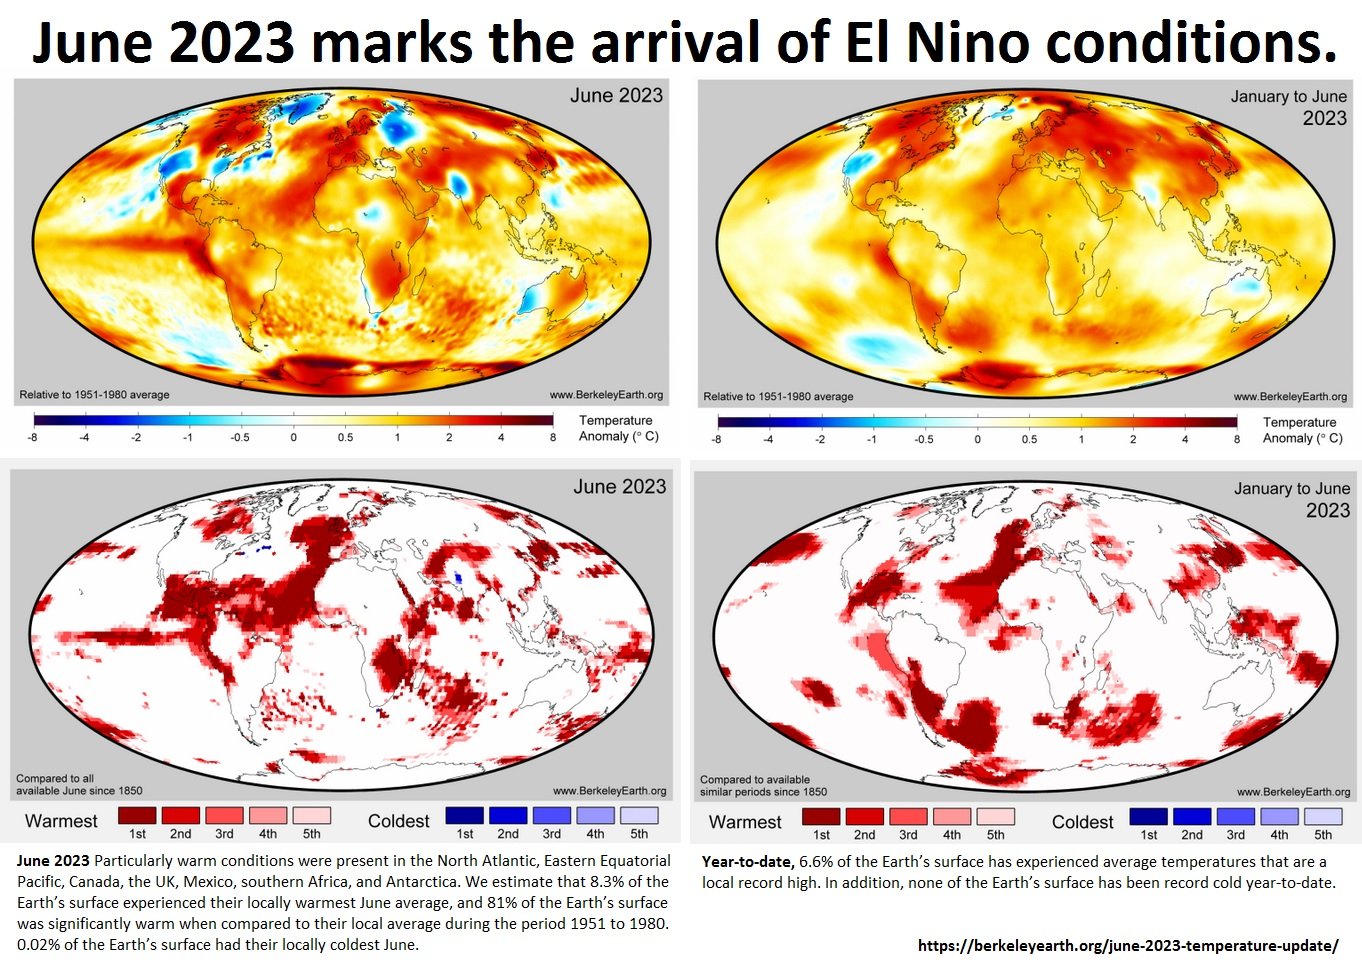
You can do some research instead of just showing what you challenge others to answer. Try this: "2023 was warmest year on Earth since direct observations began. In Berkeley Earth's analysis 2023 was 1.54 °C above our 1850-1900 average, making it the first year above 1.5 °C. The extreme heat was due to a combination of natural and man-made factors, including global warming and an emerging El Niño event. 17% of the Earth's surface had a locally warmest year, affecting 2.3 billion people, including significant parts of Asia, South and Central America." https://berkeleyearth.org/global-temperature-report-for-2023/ Their story is at https://berkeleyearth.org/about/ They also show their reporting versus the other agencies globally -
Though this and the related comments about the border are off the immediate topic... No. Beyond the GOP griping, the current US law regarding asylum seekers is what allows people to remain in the USA once they have entered. Do some research and see why the need is for Congress to get its act together and pass different laws. The senate made an attempt, and Mike Johnson said it was DOA - before even reading it. Yes, it is easier to complain than it is to devise good, well written, applicable laws - but the current stars of the GOP prefer grandstanding. To start your research, his is a useful link: • https://www.law.cornell.edu/uscode/text/8/1158
- 216 replies
-
- 13
-

-

-

-

-

-
First time the world has exceeded 1.5C for an entire year
RPCVguy replied to Social Media's topic in World News
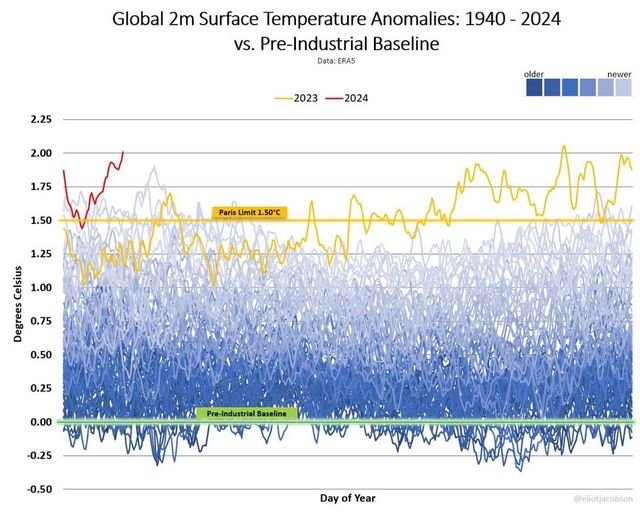
To be more precise, it is the first time since at least the beginning of the last Ice Age that Earth has been at this temperature. This El Nino cycle is expected to peak early this year - meaning heat release from the oceans soon will not be as significant a contributor to global average air temperatures. Don't expect any great relief though. The albedo reflectivity is worsening as snow and ice covered areas shrink, and the insulation factor of greenhouse gases continues to grow as their concentrations continue to increase. Here is a set of graphs covering various historical ranges: And here is the current plot of global daily air temperature anomaly. Earth has definitely averaged over 1.5ºC above the baseline agreed to by the IPCC and set as an International Goal to stay below in Paris in 2015 Image source Prof Elliot Jacobson via X, though this site by the University of Maine supplies anomaly data by date - against a more recent/ warmer baseline of 1979-2000 https://climatereanalyzer.org/clim/t2_daily/?dm_id=world The latest global surface temperature data point on Feb. 8 from ERA5 once again put the planet 2.0°C above the 1850-1900 IPCC baseline, at 2.01°C. The only other times this has happened were Nov. 17, 2023 (2.05°C) and Nov. 18, 2023 (2.06°C).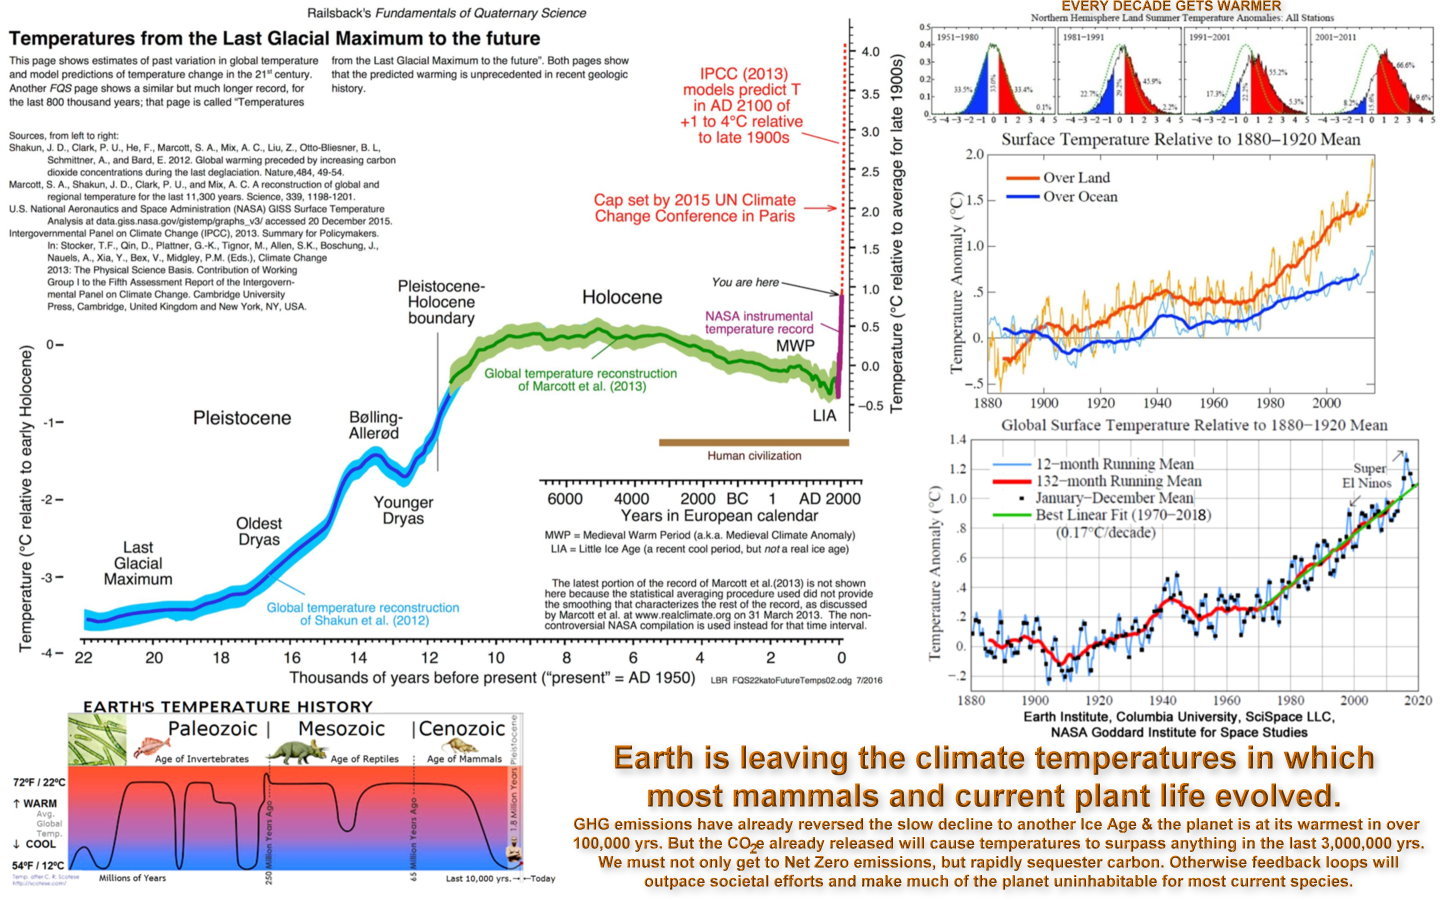
-
First time the world has exceeded 1.5C for an entire year
RPCVguy replied to Social Media's topic in World News
There are a number of women who have made discoveries for which they were not given credit. Once the error is known, it seems wrong to perpetuate the error. Among climate scientists, Eunice Foote is now recognized for her research, discovery, and presentation (documented in 1856.) It will take a while for old quotes of the prior citation to be clarified. Here is a quote, published in 2011: "Conclusion In the course of scientific discovery, it can be difficult to assess claims of priority, particularly if research results are not placed in the public domain through formal publication. This is commonplace for presentations at scientific conventions, where often only a title or perhaps an abstract is preserved for posterity. In the case of Eunice Foote's pioneering research on absorption of radiant energy by greenhouse gases, such as CO2 , and the implication that compositional changes in the atmosphere could impact climate changes, it was only through the journalism of David Wells that the originality of her work has been documented. Despite the absence of a formal publication, It is clear that Eunice Foote deserves credit for being an innovator on the topic of CO2 and its potential impact on global climate warming.” https://www.searchanddiscovery.com/pdfz/documents/2011/70092sorenson/ndx_sorenson.pdf.html The information is accessible to track. Here is another link to it: https://www.aip.org/history-programs/niels-bohr-library/ex-libris-universum/foote-note-climate-science-founder -
First time the world has exceeded 1.5C for an entire year
RPCVguy replied to Social Media's topic in World News
Small correction here. The work was done and first presented 2 years before John Tyndall in 1858 as is usually credited. It took over a century for the proper credit to be given. http://www.climatechangenews.com/2016/09/02/the-woman-who-identified-the-greenhouse-effect-years-before-tyndall/ -
First time the world has exceeded 1.5C for an entire year
RPCVguy replied to Social Media's topic in World News
Yep, a problem for habitability in the tropics as temperatures and humidity approach having days near human metabolic limits. That's especially bad for workers outdoors and those without access to air conditioning. Those with AC better hope there are no blackouts. As for the Arctic, the soils may not support what we would hope to grow, and in many areas of the Arctic, trees are toppling as the subsoil thaws, heaves, or turns to a muddy mess. -
First time the world has exceeded 1.5C for an entire year
RPCVguy replied to Social Media's topic in World News
If you think a trace gas can't have a large effect, you've never noticed how a small mosquito can affect you . Greenhouse gases are transparent to visible light, but absorb and re-radiate infrared light (heat.) Human industrial activities have caused the concentration of CO2 from the inter glacial peak of 280ppm to 420ppm, that is a 50% increase in the insulation layer of CO2. Methane and nitrous oxides have also increased. The result is that day by day more heat energy is getting stored in Earth's systems. The imbalance, expressed as watts per square meter over the planet now exceeds 1.5W/sq.m. The cumulative effect is huge. 90% of that heat is stored in the oceans. Warmer oceans lead to more intense storms. -
First time the world has exceeded 1.5C for an entire year
RPCVguy replied to Social Media's topic in World News
Interesting news today about Michael Mann: "After a day of deliberations, the jury ruled that Simberg and Steyn defamed Mann through some of their statements. The compensatory damages were just $1 for each writer. But the punitive damages were larger. The jury ordered Simberg to pay Mann $1000 in punitive damages; it ordered Steyn to pay $1 million in punitive damages." https://www.npr.org/2024/02/08/1230236546/famous-climate-scientist-michael-mann-wins-his-defamation-case -
The full 213 page decision by the Colorado Supreme court can be read at • https://www.courts.state.co.us/userfiles/file/Court_Probation/Supreme_Court/Opinions/2023/23SA300.pdf The first few pages of the text get right to the heart of the decision, with the balance being to document their reasoning and hem in the options for the true audience, the US Supreme Court. The Colorado court's decision was explicitly written to force the SCOTUS "originalists" to accept the precise wording and need for applying the 14th Amendment. I think the US Supreme Court would be doing the GOP a favor by agreeing with the Colorado Court's decision. The delay tactics by Trump's team in the DC and Georgia cases sill likely mean that the convictions that look to be assured will not happen until after the COP convention, making it too likely that by the time of the election their nominee will be ineligible for the office his MAGA fans seek to grant him.
-
Agreed! These are the basic questions for many retirees, especially retirees who have married Thai. As reported so far, this is the kind of murky, ill-defined announcement that will cause a flood of comments, and tons of anguish. (As did the forced medical insurance rule change of a few years ago.) I have no investments and conduct no business. Currently I am well below the amounts that are taxable in the USA. As it is for me, ALL of it goes to my family, helping the local town economy. This part looks encouraging, but is slippery when viewed midst the overall message of the article. "The section provides for a 15% tax rate on interest on bonds, deposits or debentures, and capital gains derived from selling shares, debentures, bonds or other financial instruments linked to companies or other juristic partnerships. The legal experts suggested that many investors, including foreigners and Thai people alike, may not be able to easily differentiate for tax purposes between the principal and income of sums moving in and out of the country, which could lead them to be taxed at a rate of 35% and in this way would become an incentive for investors to keep their money out of Thailand to avoid complications with the Revenue Department."
-
Impending drought poses significant threat to Thai export sector
RPCVguy replied to webfact's topic in Thailand News
Earth's oceans are in the midst of an El Nino, one that is forecast to be a strong one. As noted in this article, El Nino has strong consequences for Asia. • https://www.eiu.com/n/el-nino-south-and-south-east-asias-2023-wild-card/ El Nino / La Nina conditions are forecast each year around early June for the coming 12 months. The peak ocean conditions occur in the following December- February, which for Thailand means warmer weather during the seasonal dry season, often extending the duration of the typical hot, dry season of March through May (in 2019 the monsoons didn't arrive until June). We should be happy the current rainy season in topping off the reservoirs. The impending dry season is forecast to be worse than usual. -
Thai businesses warned of ‘global boiling,’ rising power costs
RPCVguy replied to snoop1130's topic in Thailand News
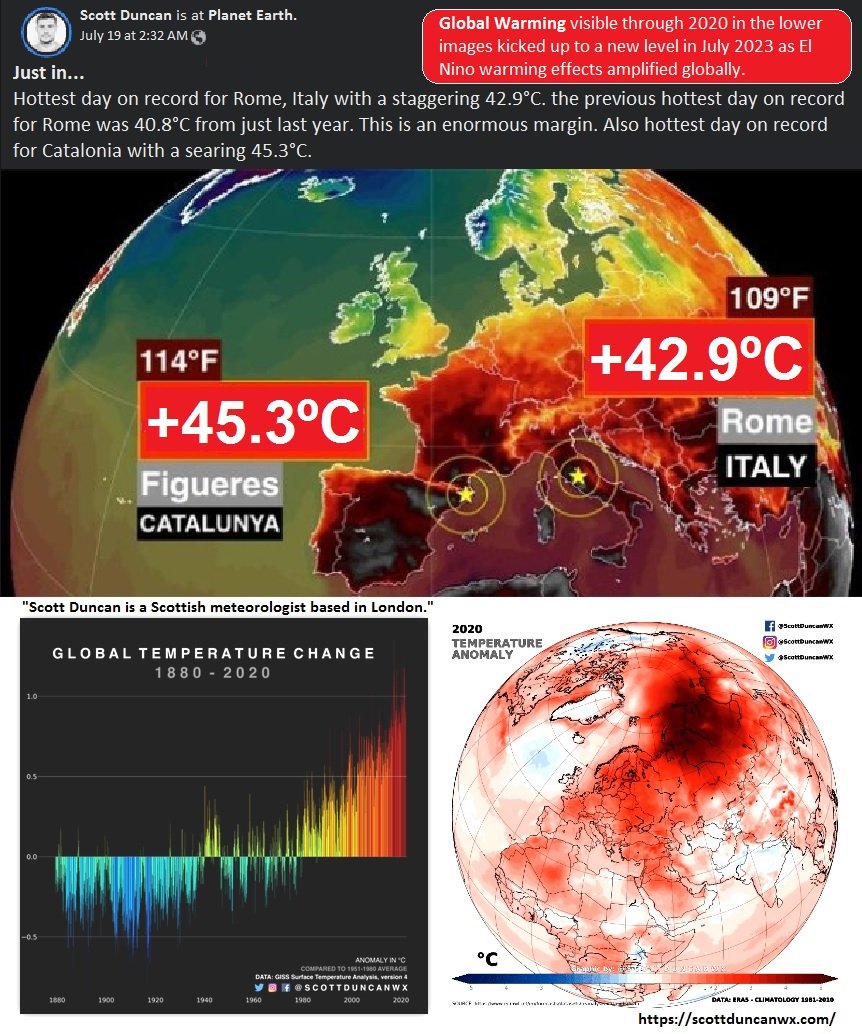
Agreed, the use of the word boiling is inappropriately excessive. BUT, just like humans suffer greatly from a fever of a few degrees, so too will the plant and animal ecosystem of the planet suffer in the warming ahead. No, THIS YEAR'S HEAT IS SET TO GET MUCH WORSE IN 2024! The effects of El Nino had barely begun by July of 2023. See images from paper by James Hansen. Historically the global peak temperatures are early in the second year of an El Nino. Early in the year also coincides closely with when Thailand has its peak heat each year. In 2016 & 2019 the dry season lasted longer than usual, local wells (including ours) went dry and the string of days over 39ºC in the north went over a month straight. Hansen's paper is at https://www.columbia.edu/~jeh1/mailings/2023/UhOh.14August2023.pdf While July was warmer than usual for Thailand, by-and-large Thailand has thus far been spared the intensity of increased warming that has already been experienced in other parts of the world. •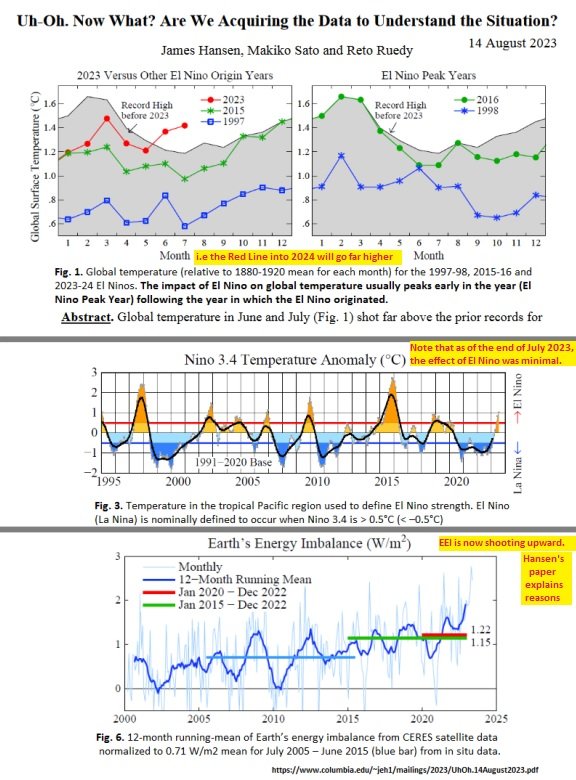
-
Judge Chuktan warns Trump against 'inflammatory' remarks before trial
RPCVguy replied to Social Media's topic in World News
The detailed argument by the 2 Federalist Society constitutional scholars will be cited in briefs going forward and will have a strong influence on cases going forward. For now, expect a number of lawsuits directed towards the respective Secretaries of State. Action needed = "each of the 50 state secretaries of state has an obligation to print ballots without his name on them.” Calabresi also “said…that they may be sued for refusing to do so.” Argument for Immediate Disqualification The article goes on to note that former U.S. Appeals Court Judge J. Michael Luttig, a “star witness” during a televised hearing of the U.S. House Select Committee on the January 6 Attack, also praised the article. He says it “promises to be of monumental — and historic, if not also contemporary — importance to Constitutional Law.” The issue has been adjudicated in several House primary cases, but will surely be tested anew after this article. Noted after Representative Cawthorn's case was appealed: Praveen Fernandes, vice-president of the Constitutional Accountability Center, which filed an amicus brief, said: “Although Representative Cawthorn just lost his party’s nomination for his seat in Congress, today’s ruling remains an incredibly important one. “It makes clear that the 1872 Amnesty Act poses no barrier to similar future … challenges of the qualification of candidates to appear on the ballot, thus ensuring that section three of the 14th amendment can continue to serve its purpose as an important mechanism for holding public officials accountable when they violate their oaths of office.” https://www.theguardian.com/us-news/2022/may/25/madison-cawthorn-appeals-court-insurrection-ruling -
Judge Chuktan warns Trump against 'inflammatory' remarks before trial
RPCVguy replied to Social Media's topic in World News
You were right, but the playing field has just been upset. The good news is that two Federalist Society, Right-wing judicial scholars join together and write a 126 page article citing in great detail why the 14th Amendment to the US Constitution is self evident to apply, that Donald Trump is DISQUALIFIED to hold ANY OFFICE in the USA. Those on the political left have said since the insurrection in 2021., But this time it is coming in a way that will prompt and win suits in many states - to remove his name from any ballots. William Baude and Michael Stokes Paulsen wrote "The Sweep and Force of Section Three" University of Pennsylvania Law Review, Vol. 172, 2024 It is fully available to view or download at • https://papers.ssrn.com/sol3/papers.cfm?abstract_id=4532751 This shift in landscape, coming from the political right, is earth shattering bad news for the former president, ... and many others in congress who supported his conspiracy. -
Climate change: July set to be world's warmest month on record
RPCVguy replied to Social Media's topic in The Green Forum
TRUE, and there is a mathematical reason. Local papers, papers playing to their region' readers often get to make the quotes shown above. Not stated is that land warms faster than oceans, and ¾ or the planet is ocean. Loss of albedo reflection allows changes in the Arctic to also be at higher than globally average rates.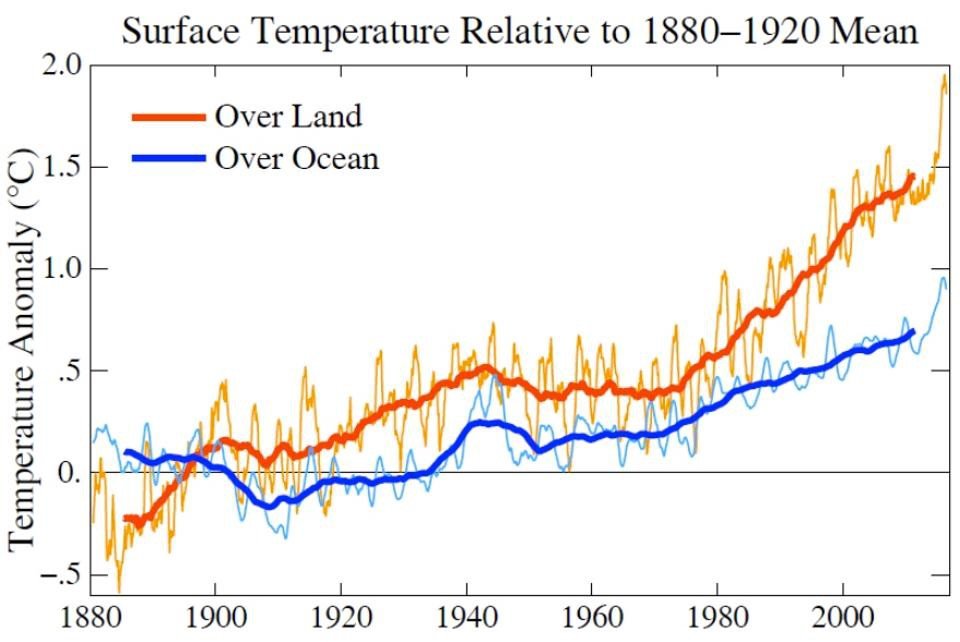
-
Climate change: July set to be world's warmest month on record
RPCVguy replied to Social Media's topic in The Green Forum
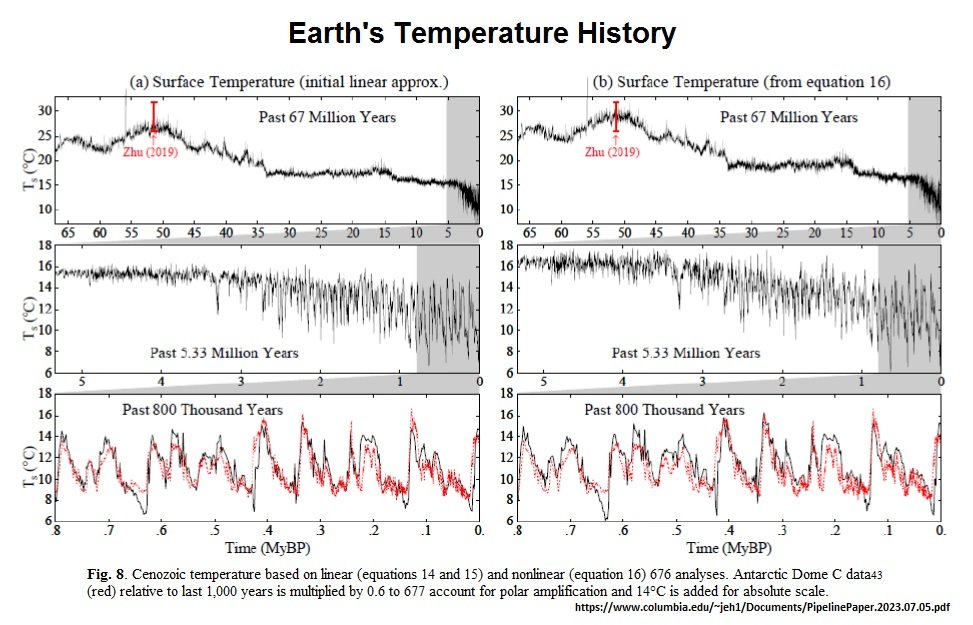
Planetary wide temperature averages have basically run between 14ºC and 16ºC through the Interglacial peaks of the last 800,000 years of Ice Ages. They also look to have remained below 18ºC for the last 5.3 million years. Those broad scale planetary average can be viewed in this first graph, taken from the latest paper by James Hansen (and 16 other climate scientists.) See: PipelinePaper.2023.07.05.pdf This should add concerns to the way Earth neared 17ºC in the La Nina to neutral year of 2022, and have now spent nearly all of July 2023 ABOVE 17ºC. We are rapidly leaving the Holocene conditions that life on Earth has currently evolved to be supported by. https://climatereanalyzer.org/clim/t2_daily/ _________________________________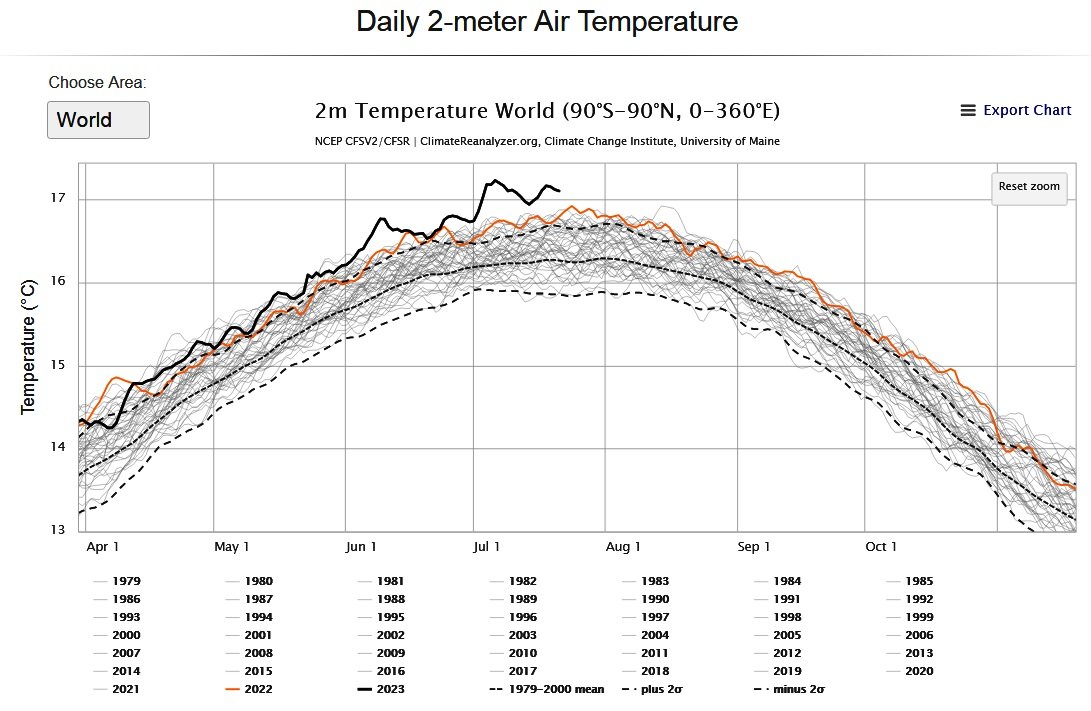
-
Since some here can't seem to speak truthfully about trends visible in line graphs, and cherry pick short time frames to point to cooling (especially as applies to Europe) ... here are a pair of images using colored maps to convey temperature changes. The first is from June 2023 Temperature Update - Berkeley Earth , and the second is from https://scottduncanwx.com/ Meanwhile, CNN Business is reporting on the early estimates of economic costs now being encountered Scorching summer temperatures could strain the economy even further | CNN Business . Lastly, insurance companies are pulling out of insuring real estate for Florida and California due to floods, storms and fires.