
RPCVguy
Advanced Member
-
Joined
-
Last visited
Everything posted by RPCVguy
-
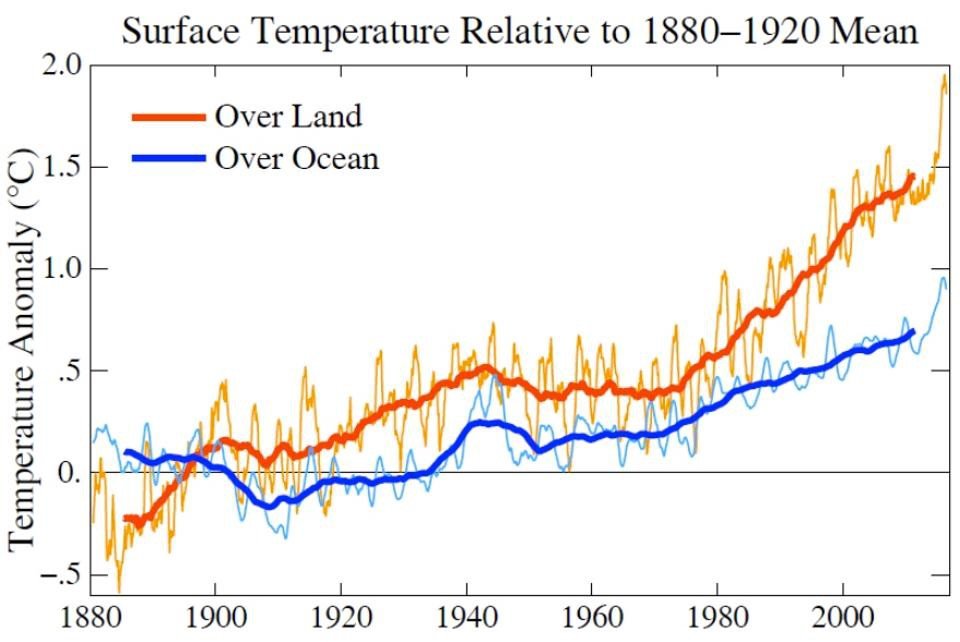
TRUE, and there is a mathematical reason. Local papers, papers playing to their region' readers often get to make the quotes shown above. Not stated is that land warms faster than oceans, and ¾ or the planet is ocean. Loss of albedo reflection allows changes in the Arctic to also be at higher than globally average rates.
-
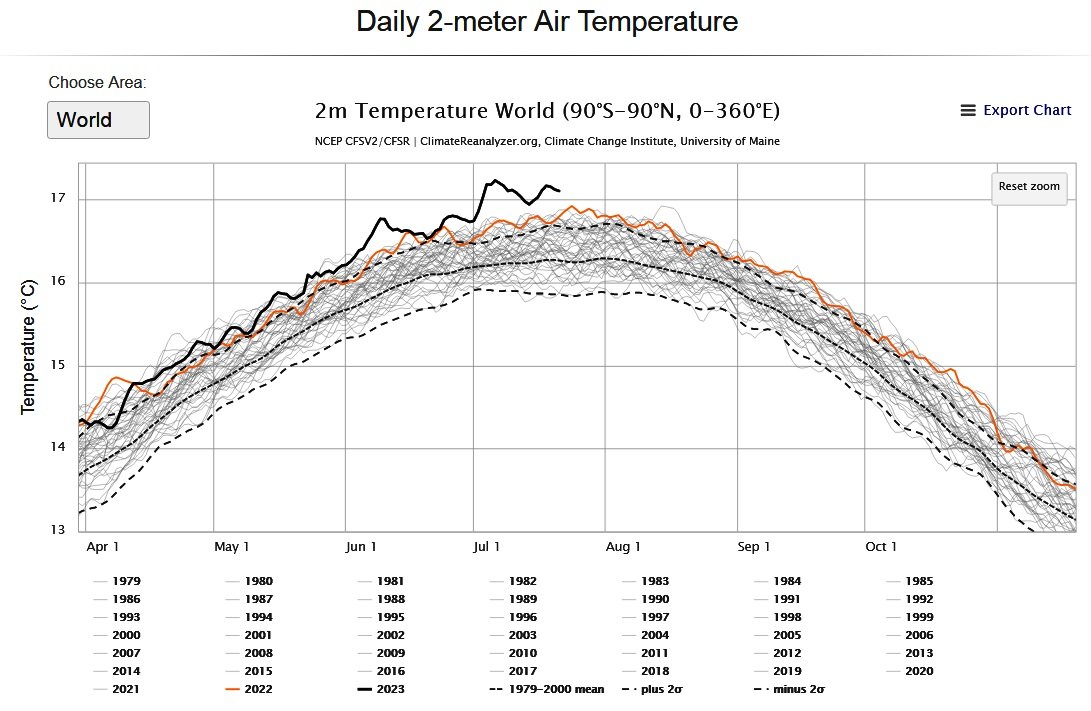
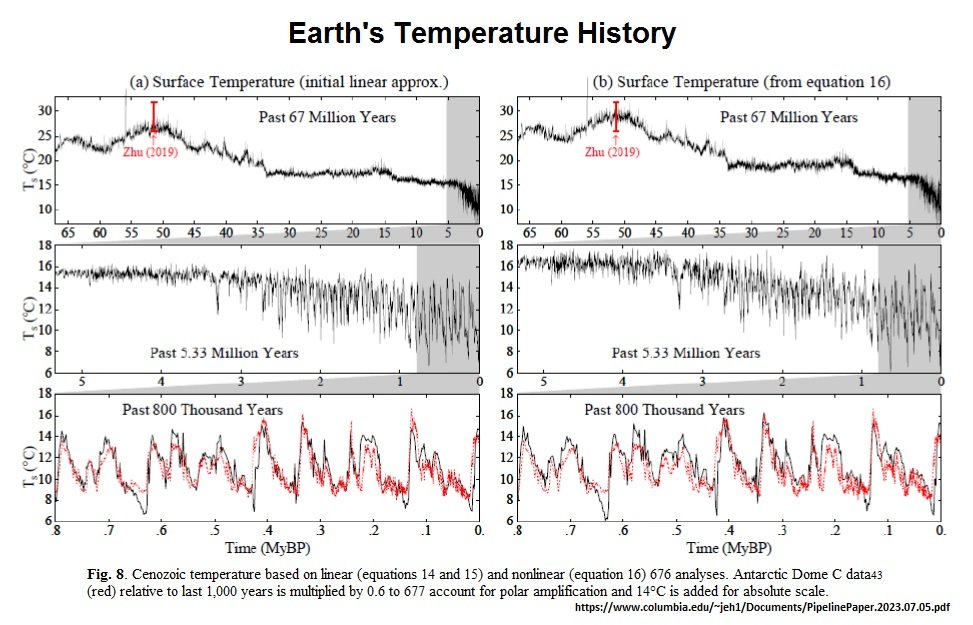
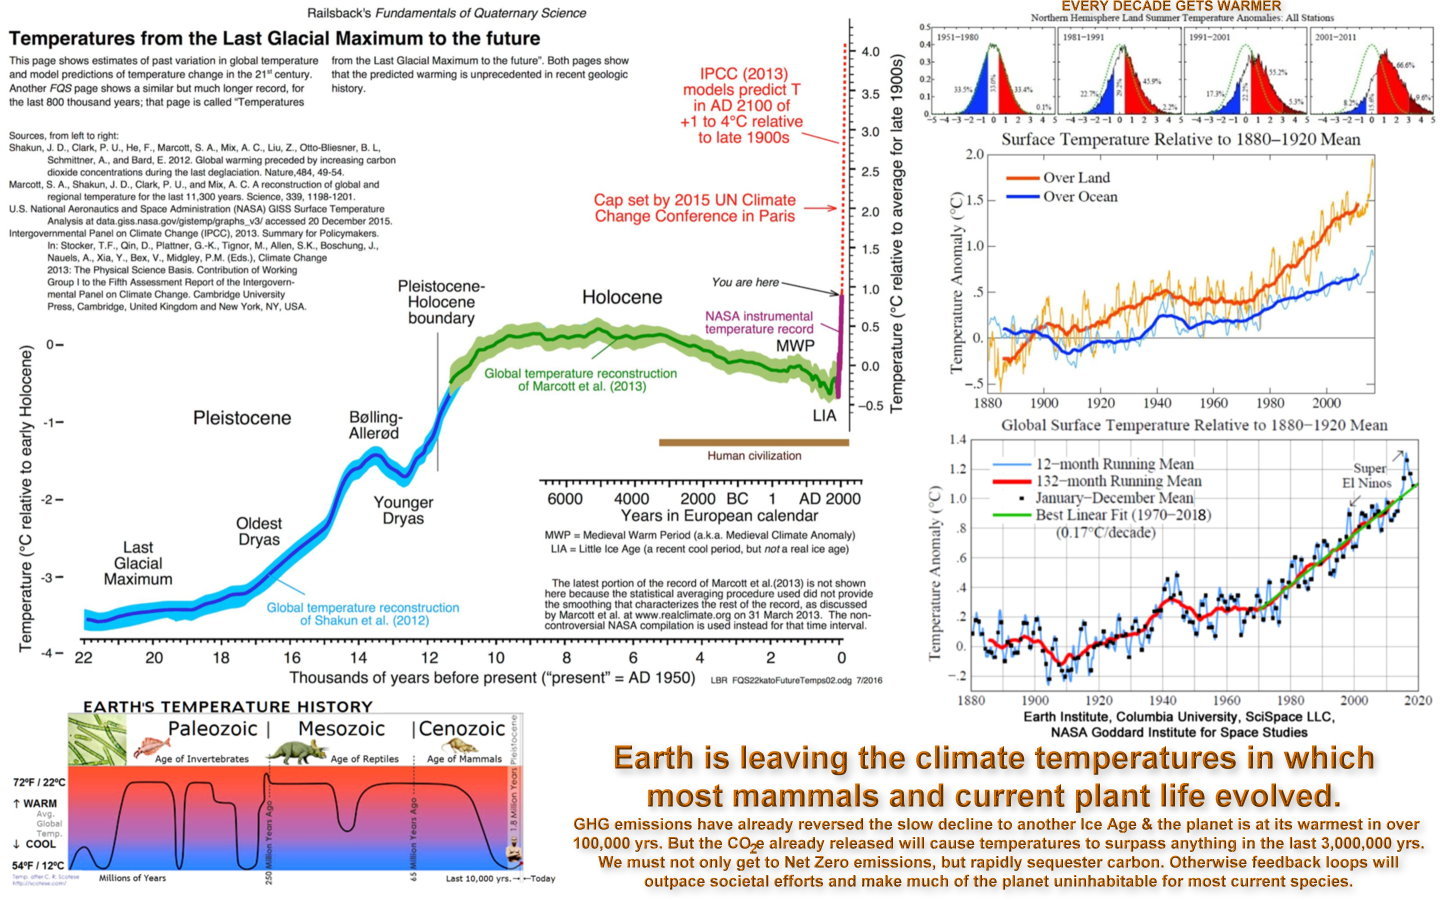
Planetary wide temperature averages have basically run between 14ºC and 16ºC through the Interglacial peaks of the last 800,000 years of Ice Ages. They also look to have remained below 18ºC for the last 5.3 million years. Those broad scale planetary average can be viewed in this first graph, taken from the latest paper by James Hansen (and 16 other climate scientists.) See: PipelinePaper.2023.07.05.pdf This should add concerns to the way Earth neared 17ºC in the La Nina to neutral year of 2022, and have now spent nearly all of July 2023 ABOVE 17ºC. We are rapidly leaving the Holocene conditions that life on Earth has currently evolved to be supported by. https://climatereanalyzer.org/clim/t2_daily/ _________________________________
-
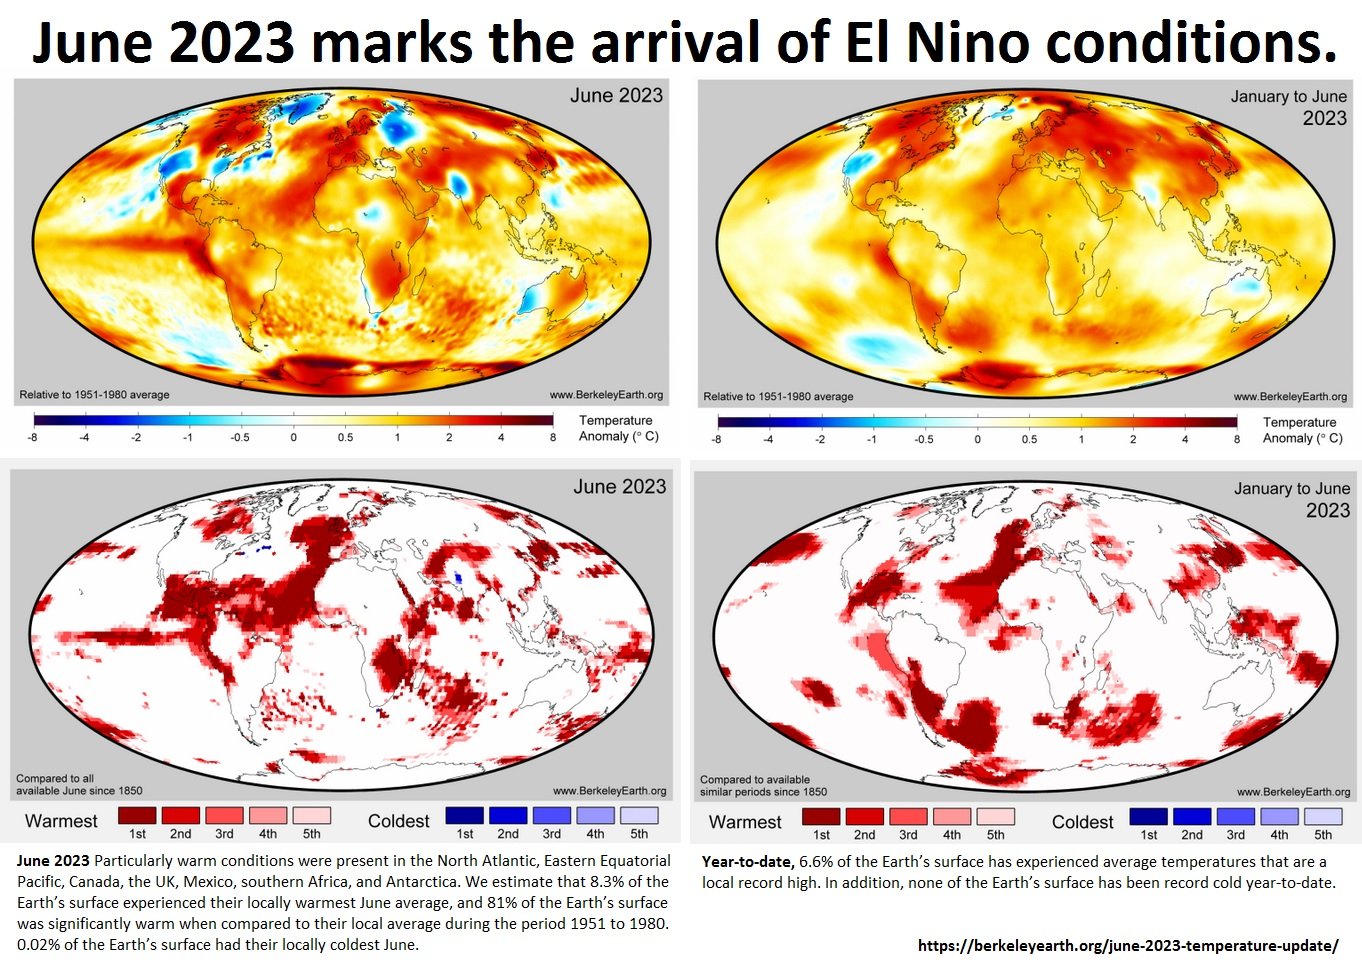
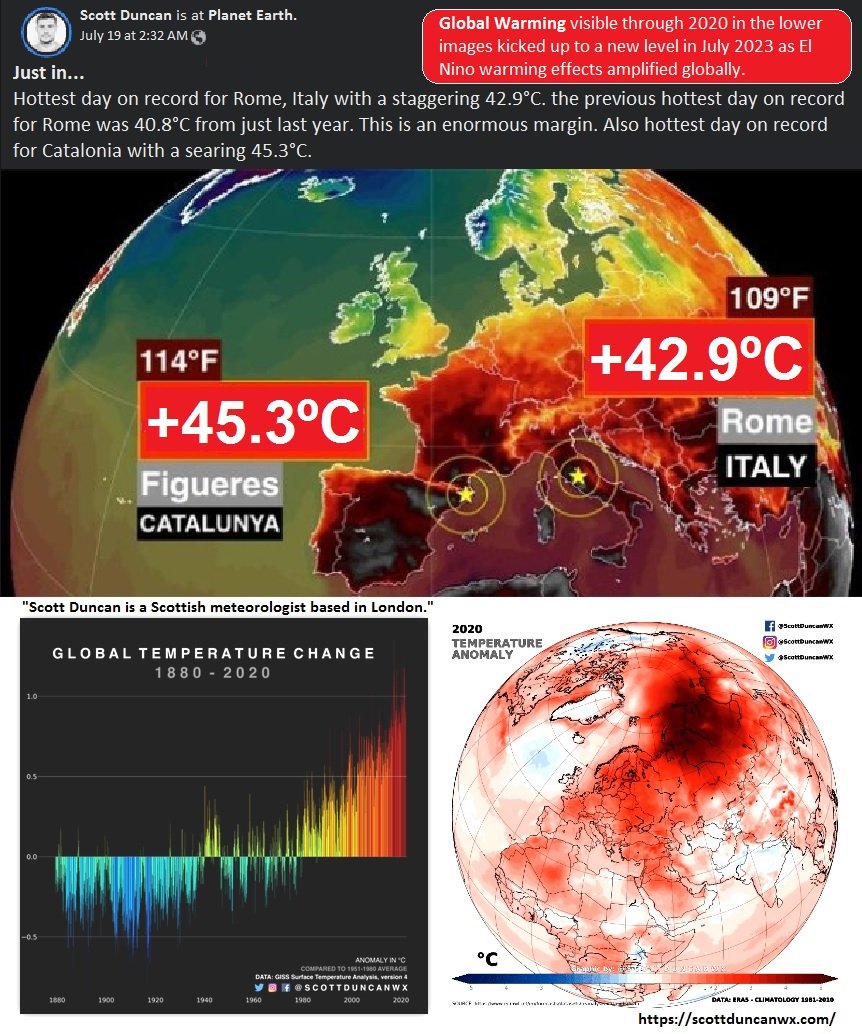
Since some here can't seem to speak truthfully about trends visible in line graphs, and cherry pick short time frames to point to cooling (especially as applies to Europe) ... here are a pair of images using colored maps to convey temperature changes. The first is from June 2023 Temperature Update - Berkeley Earth , and the second is from https://scottduncanwx.com/ Meanwhile, CNN Business is reporting on the early estimates of economic costs now being encountered Scorching summer temperatures could strain the economy even further | CNN Business . Lastly, insurance companies are pulling out of insuring real estate for Florida and California due to floods, storms and fires.
-
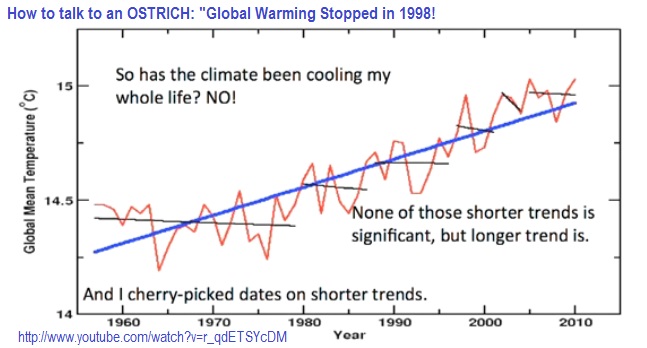
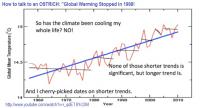
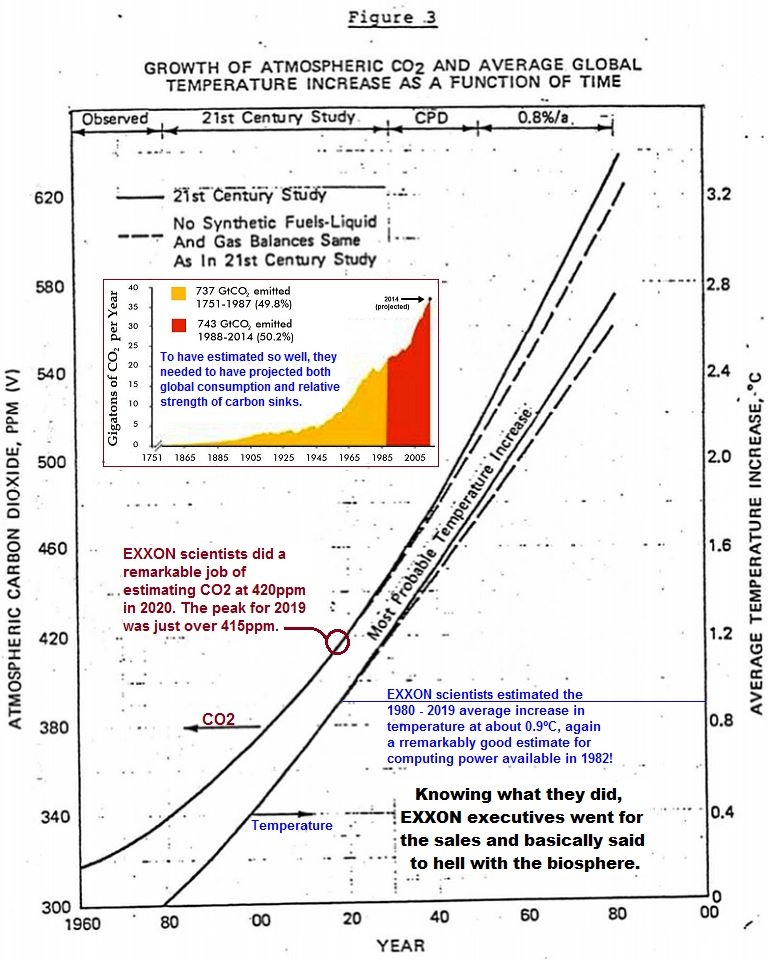
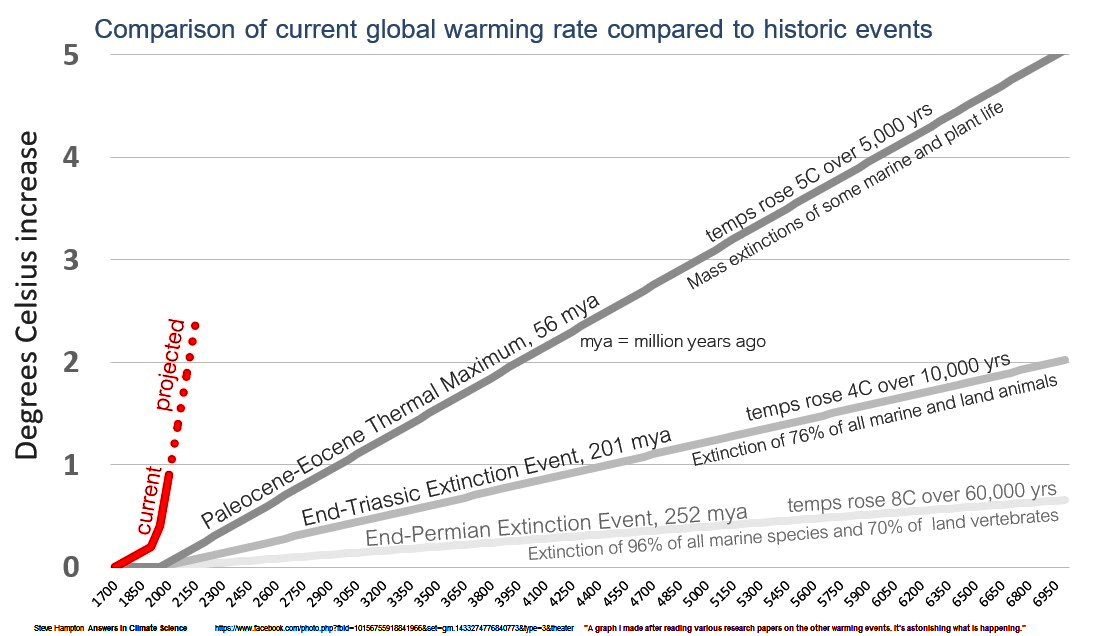
As was noted, Europe is just a portion of the planet. A shift in the Atlantic Meridional Overturning Circulation, or "AMOC," accounts for cooling temperatures in Europe. An exhaustive review of many sites through time shows our planet was warmer earlier in the Holocene, then began cooling towards another Ice Age... until the cumulative increase in greenhouse gases (predominately of CO2) halted, then reversed the cooling. We are now warmer than at any time in since the beginning of the last Ice Age. We are aiming to soon surpass temperatures since over 3 million years ago. The rapidity of change is not something trees, mammals , and the web of life upon which we depend can handle. The rapidity of change outpaces what killed of most species in past mass extinctions. This was answered with a graph accurately showing repeated 15 yr trends and the long term trend. Cherry picking the data does allow showing multiple periods of cooling (La Nina dominated cycles when the oceans soak in the heat into their depths.) BUT, the long term trend is warming... obvious to anyone who'll look. The natural cycles our planet was in for the last few million years was cooler than the norm for our planet. Weathering of rocks from past lava flows reduced the CO2 of the atmosphere as it weathered rocks into carbonates. BUT that natural cycle that allowed orbital cycles of our planet to go in and out of ice ages was halted and then reversed by the release of greenhouse gases that we humans did as we accessed and burned fossilized deposits of coal, oil and gas. (see the very long term temperature history in the bottom left portion of my first graphic.) The scientists at EXXON were tasked with researching the impact of the continued use of EXXON's main product back in the 70s, and delivered their answer in the 80's They did a remarkably good job of predicting the temperature increase we are already experiencing. This Carbon Tax idea has been reviewed and improved upon. James Hansen has been promoting a CARBON FEE & DIVIDEND plan since at least 2015. Here is his PDF on the subject as of 2019 https://csas.earth.columbia.edu/sites/default/files/content/Fee-and-Dividend-Miller-Hansen-20191110-1.pdf A search for the topic shows attempts to pass it into law in the USA, though the partisanship of politics has prevented rational application. Benefits of a Carbon Fee/Tax would be to disincentivize moving manufacturing to nations with dirtier production - automatically imposing tariffs. The benefits of the Dividend is to eliminate this as a governmental income stream. Pass the Fees back to the population on a per capita basis. Those who generate more CO2 would be incentivized to shift their habits. Those who generate less CO2 would receive cash (monthly?) to cover rising costs.
-
The planet has been warming rapidly over the past decades, sufficient to be warmer than at any time since the last ice age. Of those recent warm decades, the planet surpassed prior records on July 3rd and has remained in new record territory since then. July 7th is the current record, while July 14th still beat the 2 dates tied for the prior record. the image is a subset of the info at: • https://climatereanalyzer.org/clim/t2_daily/
-
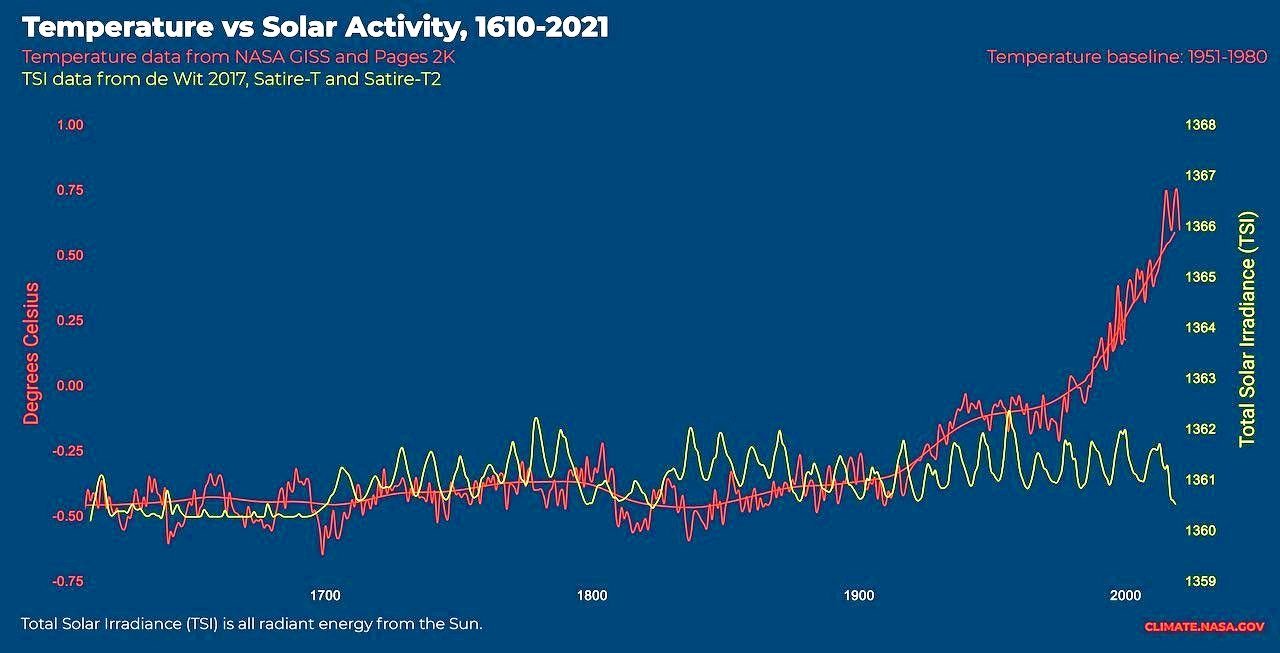
Orbital and precession shifts are slow, ... and would currently be cooling the planet. Solar cycles matter, but are not currently dominant is shifting the Earth's temperature balance. What has most affected the planetary energy imbalance, causing a net warming, is greenhouse gas accumulation in the atmosphere. These gases (CO2, CH4 and NO2) are adding to the insulation of the atmosphere. This graph definitely rebuts the notion that solar cycles are dominant at this time. What showed up as an abnormality and accumulated after 1900? ... especially in the 2nd half of the 20th Century? CO2 from the combustion of previously sequestered dead plants. Bloomberg posted an excellent animation that initially was easy to view... it compared all the major factors acting individually, then all but CO2, then all - including CO2. CO2 is definitely the dominant change to the Earth's energy imbalance. • http://www.bloomberg.com/graphics/2015-whats-warming-the-world/ This is the top link in this freely accessible page • https://earthobservatory.nasa.gov/blogs/earthmatters/2016/01/25/four-graphics-and-a-book-that-help-explain-climate-change/