

Priceless
-
Posts
1,487 -
Joined
-
Last visited
-
Days Won
1
Content Type
Events
Forums
Downloads
Quizzes
Gallery
Blogs
Posts posted by Priceless
-
-
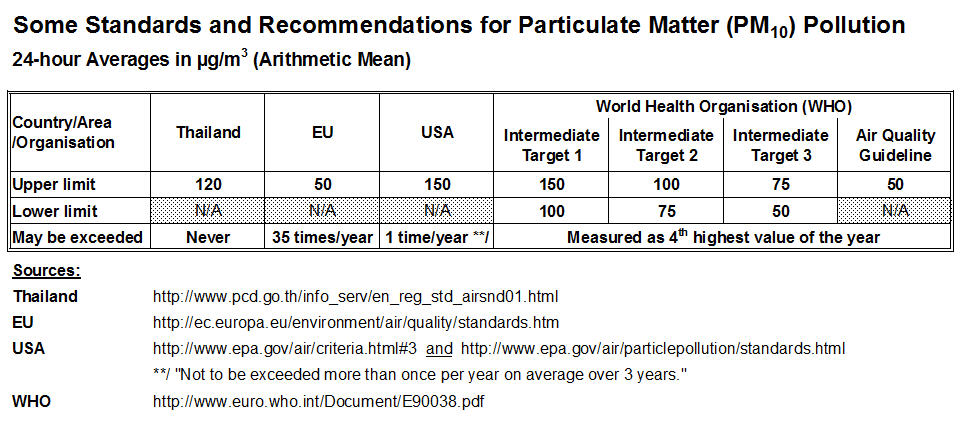
This is a very important article written by a doctor at the Faculty of Medicine in Chiang Mai, which reveals that our 'accepted safety level' of 120 microgrammes for particles less then 10 microns - is more than double the maximum safety level of 50 microgrammes set by the World Health Organisation (WHO)
The author goes on to say:
'With haze, we tend to discuss just the damage to tourism, scenery, visibility, and sore eyes and noses. Those impacts are small when compared with the long-term health risks. How many people in the North will die of cancer because of it?''
The full article is here
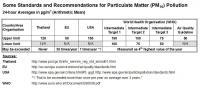
Obviously lower pollution levels are better than higher. However, the good doctor exaggerates a bit when he says 'the maximum safety level of 50 microgrammes set by the World Health Organisation (WHO)' In fact, WHO sets four levels labelled 'Intermediate Target 1-3' and 'Air Quality Guideline'. If I remember correctly (it's been a while since I read the report) there is no mention anywhere of a 'maximum safety level'. WHO on the contrary says that such a level cannot be determined. Here is a list of some standards (please note that the EU standard is not for a single 24-hour period, but rather for the 36th highest 24-hour value of the year with no maximum for a single period):
The full WHO report can be found here: http://www.euro.who....8638/E90038.pdf
/ Priceless
Perhaps the doctor is referring to the WHO saying that while "no threshold for PM has been identified below which no damage to health is observed", the guideline value from WHO has, as the doctor appears to say, a maximum level for PM10 of 50μg/m324-hour mean.
This can be found on e.g., http://www.who.int/m...heets/fs313/en/.
Maybe he is, but that is using the expression 'maximum safety level' very loosely. Anyway, what he is conveniently forgetting is the obvious fact that lowering the standard level, be it to 50 or to 0, won't change a thing. What is important is the following, from the end of the article:
'But Wijarn Simachaya, director-general of the Pollution Control Department, which sets the safety standard, said adjusting the figure would not help as surpassing it carries no penalties.
''This has nothing to do with the number, but with the burning and how well we can control it,'' he said.'
There are laws and regulations concerning polluting emissions, including agricultural burning, vehicles, industries etc., but the problem is the same as with most such things in Thailand: No enforcement!
/ Priceless
-
 1
1
-
-
This is a very important article written by a doctor at the Faculty of Medicine in Chiang Mai, which reveals that our 'accepted safety level' of 120 microgrammes for particles less then 10 microns - is more than double the maximum safety level of 50 microgrammes set by the World Health Organisation (WHO)
The author goes on to say:
'With haze, we tend to discuss just the damage to tourism, scenery, visibility, and sore eyes and noses. Those impacts are small when compared with the long-term health risks. How many people in the North will die of cancer because of it?''
The full article is here
Obviously lower pollution levels are better than higher. However, the good doctor exaggerates a bit when he says 'the maximum safety level of 50 microgrammes set by the World Health Organisation (WHO)' In fact, WHO sets four levels labelled 'Intermediate Target 1-3' and 'Air Quality Guideline'. If I remember correctly (it's been a while since I read the report) there is no mention anywhere of a 'maximum safety level'. WHO on the contrary says that such a level cannot be determined. Here is a list of some standards (please note that the EU standard is not for a single 24-hour period, but rather for the 36th highest 24-hour value of the year with no maximum for a single period):
The full WHO report can be found here: http://www.euro.who.int/__data/assets/pdf_file/0005/78638/E90038.pdf
/ Priceless
-
1
-
-
I prefer visual references to endless number crunching and graphs. Distant mountains not visible, not good.
 Next range not visible, bad.
 Closest range not visible, toxic and I don’t leave the air-conditioned room.
 Sorry I don’t have statistical data to verify my personal observations. Today’s reading in Phaya Mengrai is not bad.
Quote from Utah Department of Environmental Quality ( http://www.deq.utah.gov/FactSheets/Visibility.htm ):
'Hazy Air
Is the air unhealthy when it gets hazy? It depends. Along the Wasatch Front, the most common situation is for particles of just the right size to cause haze to accumulate first. When this happens, the visibility deteriorates more quickly than the air quality. As a result, the air looks bad with a gray or brown haze, but the amounts of PM10 and PM2.5 do not exceed the health standard. It is not uncommon for air quality to comply with health standards, even though the valleys are very hazy.
Some people, especially those with respiratory problems, feel the effects of pollution at levels that do not violate health standards. Also, the severity of haze and pollution can sometimes be similar. It is always best to know the specific health condition of ourselves and family members and respond to health advisories and increased haze accordingly.'
/ Priceless
-
1
-
-
Yet another poster that claims the Thai 24-hour standard for PM10 at 120 µg/m3 is 'so high' or 'ridiculous'. As a reference for those who like a whiff of facts with their daily diet, here are the standards for some other countries (Source: http://ehs.sph.berke...0with%20sup.pdf )
Australia 50 (May be exceeded 5 times/year)
Bangladesh 150
Barbados 150
Bolivia 150
Brazil 150
Cameroon 260
Chile 150
China 150 (Source: cleanairinitiative.org)
Colombia 150
Costa Rica 150
Dominican Republic 150
Ecuador 150
Egypt 150
El Salvador
Ethiopia 150
The Gambia 50
Ghana 70
India 100
Indonesia 150
Israel 150
Jamaica 150
Japan 100
Korea, Rep. 150
Mauritius 100
Mexico 120
Nepal 120
New Zealand 50
Peru 150
Philippines 150
Senegal 260
Singapore 150
South Africa 75
Trinidad & Tobago 75
Turkey 150
United States 150
Vietnam 150
Serbia 50
Zambia 75
/ Priceless
-
1
-
-
I'm afraid that Wikipedia has failed to inform the EU that the standard has been changed
Either Wikipedia knows something we don't know and the EU publications are not up-to-date, or they are simply wrong. Given Wikipedia's past performance I tend to believe the latter, but I suppose we cannot clarify this easily. Even with the 35 days exceedence standard, most of northern Thailand looks 'exceedingly' bad air-pollution-wise.
While I appreciate the statistics, I have to say that the PM10 data from a few measuring stations hardly captures the whole picture. Not only might other pollutants also play a role, but to understand the full socio-economic impact, one would have to look at the number of hospitalisations, the number of respiratory and cardiac medical cases, the number of sick notes and absences during the burning season, the number of people reporting discomfort, properties and habitats destroyed by fires, ecological consequences, as well as travel and migration patterns, tourist arrivals, etc.
Cheers, CMExpat
The answer to your first query is quite simple: Wikipedia refers to directives 1999/30/EC and 96/62/EC. These are completely outdated. The current directive is 2008/50/EC that I quoted from and gave a link to. Incidentally, the EU does not live up to its own standard. According to their latest report ('Air quality in Europe — 2011 report', http://www.eea.europa.eu/publications/air-quality-in-europe-2011 p27) 20-25% of the population resident in EU urban areas is exposed to PM10 levels in excess of the 35-day standard.
As for 'While I appreciate the statistics, I have to say that the PM10 data from a few measuring stations hardly captures the whole picture.', this is quite obvious and I don't think anyone has ever claimed that it does. As for 'other pollutants' none other than PM10 has, as far as I know, ever exceeded their respective threshold levels here in Chiang Mai.
If 'to understand the full socio-economic impact, one would have to look at the number of hospitalisations, the number of respiratory and cardiac medical cases, the number of sick notes and absences during the burning season, the number of people reporting discomfort, properties and habitats destroyed by fires, ecological consequences, as well as travel and migration patterns, tourist arrivals, etc' is a requirement, I think that you can rest reassured that you can continue complaining for at least another generation or two. You may not have noticed, but we live in a third-world country where a complete picture like the one you want has (I believe) never been put together anywhere in the world. In fact, if I have understood the WHO report 'Air Quality Guidelines Global Update 2005' correctly, the causal relationships that you are asking for are largely beyond the current state of science.
I, for one, am quite amazed at the level of ambition of the PCD in posting all the data that it does. This gives us an opportunity to at least follow the ambient air quality with a surprising breadth and depth of detail.
/ Priceless
-
1
-
-
Do you have a source for this?
I'm afraid that Wikipedia has failed to inform the EU that the standard has been changed:
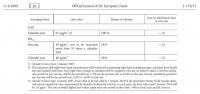
(Source: http://eur-lex.europ...001:0044:EN:PDF )
/ Priceless
-
1
-
-
As a newcomer to Chiang Mai let me say that this statement is absolutely correct. The air here is surprisingly bad. There were a few days in March where I was in genuine fear for my health.
I concur, and I am not a newcomer. This was a bad year and the air was nothing short of crappy in February. The PCD numbers actually support that. If you take the EU limits as a measure of "good and bad", and not the forgiving Thai limits, then the entire season is in fact bad, every single day of it. The new EU (2010) standard allows only seven PM 10 exceedences > 50 µg/m³ per year vs. 35 exceedences before that. Guess what, the monthly averages in the hazy season exceed that value. The EU limits are totally out of reach if even the relaxed Thai safety standards cannot be met!
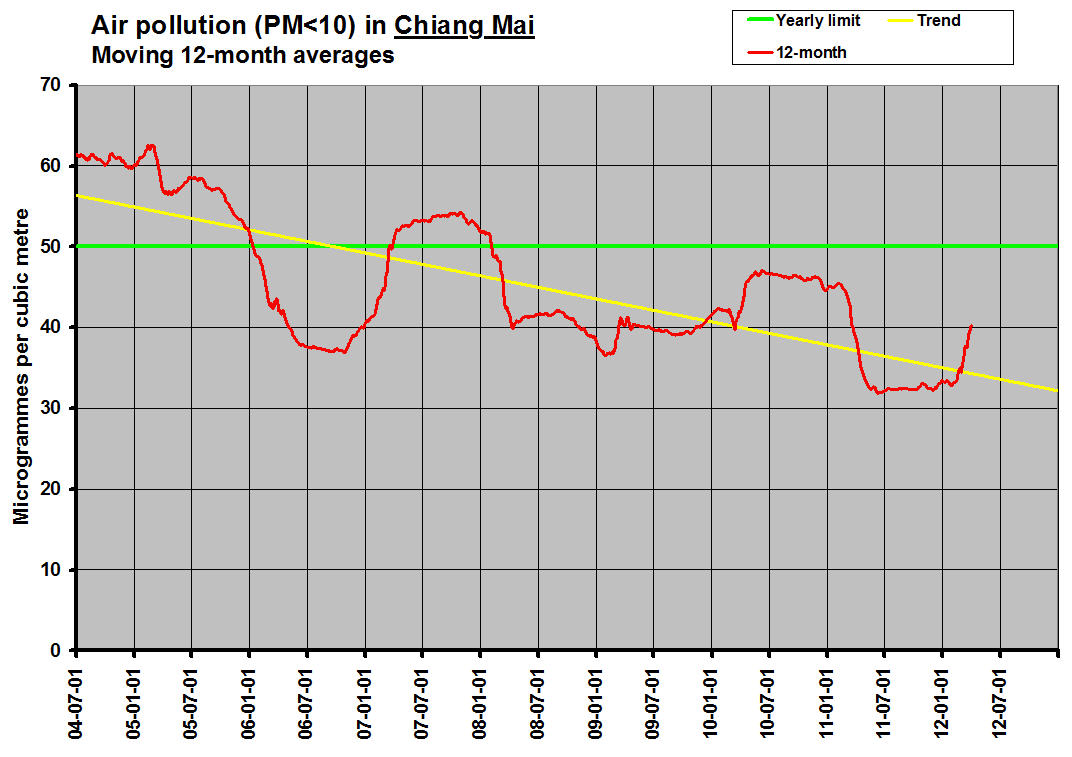
Of course, this is hardly news for people living here and it has long been recognised as a serious problem. People getting increasingly fed up with the lack of action. In my view, the downward trend is a statistical fabrication that rests on the haphazard selection of data points. There are currently no effective problem solving measures under way, and hence, there is no downward trend.
I am also anthipathetic to the image of innocent farmers exercising traditional farming methods. Sorry, this is the 21st century. These people are engaging in destructive practices that destroy lifes, either directly through killing animals in forests and fields, or indirectly by making thousands of people sick. These actions have serious karmic consequences and need to be addressed with education and regulation on the part of the government. If anything has changed this year, it's probably the emergence of a consensus that the "it's not so bad" faction hasn't got their facts right.
Cheers, CMExpat
Do you have a source for this? My source is http://ec.europa.eu/environment/air/quality/standards.htm which states 35 exceedences per year (not that all of EU lives up to that).
/ Priceless
-
1
-
-
Suggesting that the readings for February were 2% and 16% below the 2004 - 2012 averages is surely not meaningful and must distort the picture since the peaks and valleys for the subject period are so extreme - there were extreme peaks and radical lows during that nine year period.
I consider it quite 'meaningful' if the purpose is to demonstrate that February of this year was quite average. In fact, the value for 'Chiang Mai' was the fourth highest and the one for 'Uparaj' was the fifth highest of the nine-year period.
Since 'nikster' suggested that 'this year was surprisingly bad already in February', I find it quite reasonable to show (not 'suggest') that he is wrong.
/ Priceless
-
1
-
-
Yeah, well, we'd need tables with data for February, March, and April. The pollution doesn't just stop outside of March, and this year was surprisingly bad already in February - so bad that we took off, actually.
The other reason I thought this year was the worst is that things simply didn't improve until we were south of Bangkok - visibility-wise. In years past, the cutoff point for bad air had been Tak, 3 hours south of CM. This year... bad air all the way through to BKK. This was in February.
And then, as has been posted earlier, the health effects are more complicated than that too, with peaks being more harmful / averages less important than peak values.
By the way the official air quality website shows a max value of 318 for Chiang Mai - not seeing this in your charts either.
I didn't include April for the simple reason that the 2012 version of it hadn't occurred when I put the tables together (and still hasn't, I think your almanac is running fast).
I'll give you some figures for February, though:
'Chiang Mai' (City Hall)
Monthly average: 78.2 µg/m3 (2% below the 2004-2012 average 79.4)
Maximum 24-hour average: 179.4 µg/m3
Number of 'bad days' (i.e. >120 µg/m3): 1 (with 5 missing observations of which 3 may have been >120)
Consequtive 'bad days': 1
'Uparaj College'
Monthly average: 76.9 µg/m3 (16% below the 2004-2012 average 91.6)
Maximum 24-hour average: 174.0 µg/m3
Number of 'bad days' (i.e. >120 µg/m3): 4 (with no missing observations)
Consequtive 'bad days': 3
Your statement 'this year was surprisingly bad already in February' seems to be based on some location other than Chiang Mai, or else concern only the 25th to 27th of that month.
I stick to 24-hour averages for the simple reason that all the standards that I have seen, from different countries/organisations, are shown that way. Incidentally, it would be very interesting if you would give a (credible) source for your statement 'peaks being more harmful / averages less important than peak values'. In its 'Air Quality Guidelines - Update 2005' the World Health Organization says 'Based on known health effects, both short-term (24-hour) and long-term (annual) guidelines are needed' (p 277).
/ Priceless
-
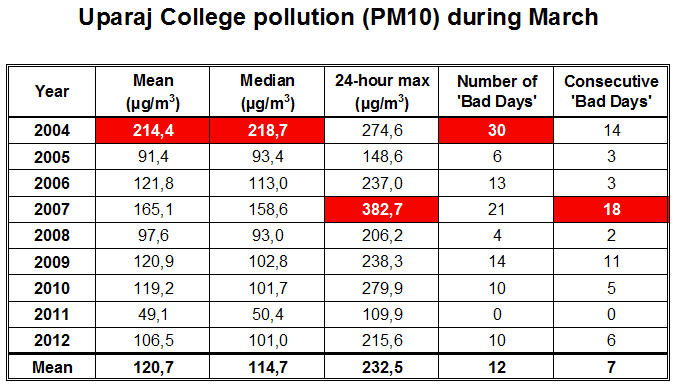
My sincere apologies to readers of my previous "comparison post" (#790 above). I have just discovered an error in the 'Uparaj' table, which should have looked like this:
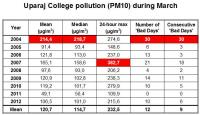
The observant reader will notice the changed number of consequtive 'bad days' for 2004, up from 14 to 30!
/ Priceless
-
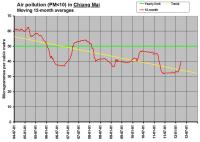
Wow, thank you very much, that's an excellent summary! I guess that also means that this year didn't seriously affect the overall downward trend (especially not as last year the haze went AWOL completely.
You are right, so far the downward trend has not been affected. The trend in this graph is estimated using data up to 31 March of this year. As you can see, each "peak year" (2004, 2007, 2010 and 2012) has a lower peak than the previous one. Let's just hope that this continues

/ Priceless
-
Priceless, do you have the numbers for Chiang Rai, Mae Hong Son, Lampang and Lamphun? It seems these cities have been more affected this year than Chiang Mai.
Cheers, CMExpat
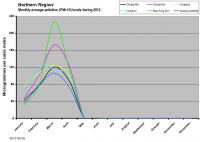
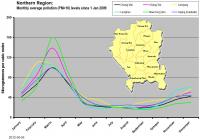
I do have the numbers in my database, but unfortunately no ready-made tables like those for 'Chiang Mai' and 'Uparaj'. However, the following graphs may serve to answer your question, even though they only show monthly averages. The first graph covers this year and confirms your impression. The second graph shows the period 2009-2012 (i.e. since the Pollution Control Department started posting values for more locations than 'Chiang Mai', 'Uparaj' and 'Lampang') and demonstrates that this is actually the normal situation, i.e. that Chiang Mai has had the lowest pollution levels in the Upper North during this period.
/ Priceless
-
Hazy Season Ends Today, from today onwards we're in the Hot Season!
(Had very widespread wind and reain all over the North last night, showing the change.)
Priceless: Let's draw up the stats for this season, as we won't get another 120+ day this year.
How does this year compare against 2007? Subjectively I feel that 2007 had some days that were worse, but also that this year had more days above 120. But I'll let Excel do the talking.
Thank you for an interesting question (and also that it is a question, not some deluded claim like some other posters prefer).
There are numerous ways to define 'worse'. I tend to mostly use the following five:
[1] The monthly average (arithmetic mean) in µg/m3 (can be stronglly influenced by a few extreme values).
[2] The monthlly median, i.e. the value at which half the daily values are higher and half are lower (not influenced by extremes).
[3] The highest 24-hour average.
[4] The total number of 'bad days', i.e. with a concentration in excess of 120 µg/m3.
[5] The number of consequtive 'bad days'.
Here are tables with these five values for March of the years 2004-2012:
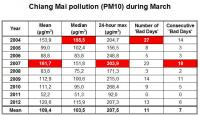
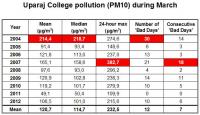
As you can see, this year was nowhere near the worst over this period. At City Hall the average was 10% higher than the 2004-1012 average whereas at Uparaj it was actually 7% lower. I think that the problem is the imperfection of the human memory. More recent events tend to dominate over older ones so that this year is more polluted/less polluted, warmer/colder, rainier/less rainy etc than previous years.
/ Priceless
PS I wish I could share your conviction that we will not have another 120+ day. I'll admit that 'bad days' are very rare in April, a total of 15 this century, but of those nine (9) occurred during April of 2010!
-
Is there any alternative to aqmthai.com for the latest information.
http://aqnis.pcd.go.th/report/northernhaze/2012-APR has daily reports on the 24-hour average from 9 AM - 9 AM. Usually available slightly before noon.
/ Priceless
-
1
-
-
According to the AQI figure in my sons school this morning, the AQI is 60. I guess they got it before they decided to password protect the figures
for some reason. Driving there you cannot see Doi Suthep at all, and you can see smoke lying across all the fields on the way. If that is the real figure, then something is very wrong.
One measuring station in CM out of service, followed by website changes, followed by readings that to my eye and nose are way too low (having kept a close eye on visibility and figures for
a consideable time). Also, all these changes take place just after the time the governor of CM is told to do something, and his immediate response is to spray water around from fire engines as a publicity stunt,
and little else from what I can see. Call me a conspiracy theorist, but something stinks, and it is not just the air.
The relative humidity was 83% at 7:00 AM. The bad visibility (only 2,500 metres at the airport) is in all probability due to a meteorological phenomenon called FOG.
The AQI figure is probably from yesterday, it seems to fit in with the observations from City Hall (77.3) or Uparaj (64.3).
The password protection of the aqmthai.com website is obviously idiotic. It seems that they do all their work on the live site, instead of working off-line and then uploading. Competent they are not!
/ Priceless
-
1
-
-
The table row showing air pollution at Chiang Mai City Hall has been removed from the aqmthai.com website. I can only conclude that the local problem has been solved in the time-honoured Thai fashion. I.e. the existence of the problem has been denied and thus the problem does not and has never existed. All evidence has gone up in smoke and EVERYTHING IS JUST ROSY! SO KEEP SMILING!! AND DON'T COUGH!!!!!!
OMG you're right!!!
It was there yesterday but has text to the effect of "Not Available" in place of the number we'd usually see.
The officials who are responsible should consider just exactly what they are doing by moving to withhold this information. Adverse health consequences experienced from this point forward can rightfully attribute this decision as cause.
You people should think again. If you go to the reports on Northern Haze ( http://aqnis.pcd.go.th/report/northernhaze/2012-APR ) you will find the following concerning yesterday's data for 'City Hall' (according to Google Transtale): 'No data due to equipment failure.'
The figure for Uparaj College is 65.2 µg/m3, so I don't think you should worry too much about health effects right now.
The 'Public Report' site ( http://aqmthai.com/public_report.php ) has been down on and off for the last two months due to ongoing work on the software. I'll admit that working on the live site, instead of working off-line and then uploading, says a lot about the qualifications of PCD IT staff, but suspecting sinister intentions probably says more about you than about PCD.
/ Priceless
-
1
-
-
What's up with the air quality website (http://aqmthai.com/), last post for CM City Hall was for 11:00 on Friday. Seems pretty bad today again, perhaps a coincidence or maybe it's a conspiracy?!? Seriously any ideas?
It appears that they are working on the website, it's been password protected for most of the day. The measuring station at City Hall has been down with technical problems since Friday. Will be interesting to see if it's up when the website comes up again.
/ Priceless
-
1
-
-
Ate at Duke's Riverside once and never again. One of the worst meals I've eaten in Thailand. Soggy, limp, oil-soaked chips, Caesar salad sans anchovies, and a dried out bun for the burger - except for the bottom which was swimming in juice from the unrested burger patty. Never again.
Wikipedia: 'A Caesar salad is a salad of romaine lettuce and croutons dressed with parmesan cheese, lemon juice, olive oil, egg, Worcestershire sauce, garlic, and black pepper. It may be prepared tableside.'
If you wanted anchovies, maybe you should have ordered them?
/ Priceless
The original Caesar salad recipe did not contain pieces of anchovy; the slight anchovy flavor comes from the Worcestershire sauce (which is basically mushed up anchovies, often a shock to anchovy haters). Therefore Caesar Salad with actual anchovies minus the Worcestershire sauce is quite usual and often preferred, and here in Thailand is probably cheaper to make given the relative price of Lea & Perrin's and anchovies.
So, what 'Yme' is complaining about is that he got the original and not a cheaper substitute?

/ Priceless
-
Rain
in Chiang Mai
How much rain did CM get last night? We had two rounds of serious gully-washer type rain here in Mae Taeng. First round lasted two hours and we had lots of thunder and lightning. Very nice morning now.
5.2 mm at the airport, spread out over nine hours or so. Should help quite a bit with the pollution.
/ Priceless
-
Ate at Duke's Riverside once and never again. One of the worst meals I've eaten in Thailand. Soggy, limp, oil-soaked chips, Caesar salad sans anchovies, and a dried out bun for the burger - except for the bottom which was swimming in juice from the unrested burger patty. Never again.
Wikipedia: 'A Caesar salad is a salad of romaine lettuce and croutons dressed with parmesan cheese, lemon juice, olive oil, egg, Worcestershire sauce, garlic, and black pepper. It may be prepared tableside.'
If you wanted anchovies, maybe you should have ordered them?
/ Priceless
-
2
-
-
The visibility today from my 4th floor condo could not be more than 1200-1500 meters. My views of Doi Sutep.......what mountain! I don't know how the airport can remain open given these current conditions.
The airport reports visibility 2,800 metres at 13:00 local time.
/ Priceless
-
- Popular Post
- Popular Post
The most corrupt agency in Thailand... that's quite an achievement. I'm sure their boss will be very proud, whoever he is.
Thaksin's ex-brother-in-law.
/ Priceless
-
7
-
How is the air right now? Does the recent lack of posts on the subject suggest improvement?
Missus Dude and myself plan to visit Chiangers next month but I'm loathe to book the flights until it becomes apparent that the burning season is over and the air's moving towards a healthier state.
Slight improvement. Can see the mountains now at least. Kids seemed to have stopped coughing too. Still hazy though, the sky is a mix of grey and faint blue.
The 'slight improvement' means that the pollution level is considerably less than half what it was just ten days ago, and about 30% below the 'safe limit' of 120 µg/m3. No guarantees for the future, though...
/ Priceless
-
1
-
-
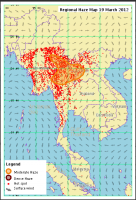
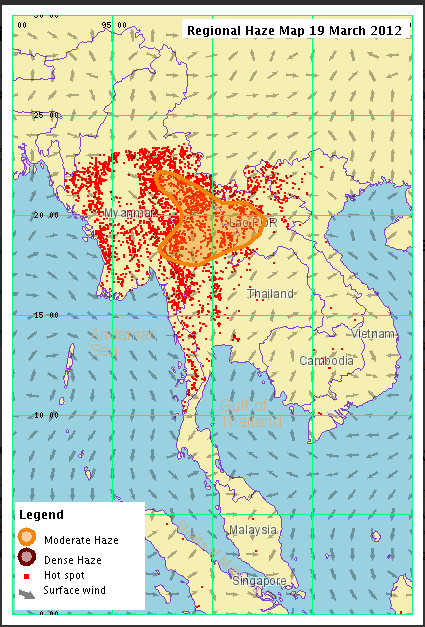
Thanks for the very useful information. - Just to add the EU has a limit of 50 ug/m3 for PM10 (http://www.env-it.de...A4E5.2?comp=PM1). - I attached a Regional Haze Map from yesterday, courtesy of aqmthai.com. They say 'Moderate Haze'...I googled it and can't find much info, what are the "205.68" numbers? I assume its measuring air pollution or air quality and higher is worse, what is bad? How to track this? How does this compare to say Los Angeles?
The number '205.68' is the amount of pollution by particles in the air of less than 10 micrometers in 'aerodynamic size' (PM10), expressed in microgrammes per cubic metre (µg/m3). These are the particles that are breathable, i.e. can enter your respiratory system and lungs. The number could most usefully be compared to e.g. the Thai standard which is 120 µg/m3 or the USEPA standard which is 150 µg/m3. According to more recent research the most unhealthy part of this pollution is the particles that are less than 2.5 micrometers (PM2.5). However, as far as I have been able to find out, only USA and Canada currently have standards for PM2.5 in force, though EU will have a limit from 1 January 2015.
It is important to note that the standards relate to 24-hour averages, single 1-hour measurements may be much higher or lower than that since large diurnal variations are common. To get an idea of the PM2.5 levels when you only have access to PM10 values, the World Health Organisation suggests that about half of the PM10 concentration consists of PM2.5 'in urban areas in developing countries'.
/ Priceless
 But interesting the wind directions.
Yes, but as has been pointed out several times before, the EU limit is not for a single 24-hour period. It is instead for the 36th highest value of a calendar year, i.e. 10% of the year may have higher values than that, with no maximum limit. (This is the reason why I did not mention the EU limit.)
/ Priceless
-
1
-


Smoke, Smog, Dust 2012 Chiang Mai
in Chiang Mai
Posted
The Thai limit may not ever be exceeded. That in fact it is, puts Thailand in the same group with USA and EU that don't live up to their limits, either. (E.g. 20-25% of the urban EU population live in areas where the 35 times per year llimit is exceeded.)
/ Priceless