

Priceless
-
Posts
1,487 -
Joined
-
Last visited
-
Days Won
1
Content Type
Events
Forums
Downloads
Quizzes
Gallery
Blogs
Posts posted by Priceless
-
-
I must admit that I somewhat fear the coming March. Luckily, there's not a very strong correlation between the PM10 values for February and for March (0..63 for the 'Chiang Mai measuring station) so I'm still keeping my fingers crossed
/ Priceless
No No
I mean what do you think of a march.....a demo....a protesting mob?

Cheeryble
I understood that perfectly well. However, since people are complaining so much about this past February i thought it relevant to say something about the coming March (i.e. the month).
As for your march, I think that you might irritate a few people. Apart from that, I don't think you will achieve anything. Political demonstrations by foreigners are not that appreciated here, in my experience (though other posters might not agree).
/ Priceless
-
Apparently you don't consider it a 'mainstream bank', but I bank with SCB. There are regularly two whole banking days between the sending date and the arrival date, i.e. if the money is sent from my Swedish bank (any time before 3 pm CET) on a Monday it is in my SCB account on Thursday (usually before noon).
/ Priceless
-
This year is extraordinary!
[...]
Well not really, I'm afraid. Since the 'Chiang Mai' measuring station suffered a breakdown for four days (25-28 February) I looked at the Uparaj station numbers instead. Of the previous eight years (2004-2011) four had significantly higher February pollution levels than this year (2004, 2005, 2007 and 2009). Two had levels pretty much equal to this year (2006 and 2010). Only 2008 and 2011 were significantly better.
I think what we are facing is the human tendency to remember more recent events (in this case 2011) a lot more strongly and think that these events are the norm. The latter half of February and most of March are usually bad and (so far) this year has followed that pattern.
I'm crossing my fingers that the pattern will be broken this March
/ Priceless
Hi Priceless
As a student of the mind I'm with you on the human tendencies to forget the past and emphasise the present....however in this year's case it's the number of affected people I personally meet regularly which to me is extraordinary.
I know anecdote is not the gold standard, but two more people are now added to the 5 on my sick list.
My 30yo girlfriend has a bad allergic reaction, and Howard Graves is off colour and has just called off all operas for the month.
As for CM residents actually doing something instead of navel gazing....what do you think of a MARCH?
I remember there's a highly respected older Thai activist who has a big network of schoolkids who could perhaps do something.
I know there used to be an activist group about this.....know anything about it?
Cheeryble
I must admit that I somewhat fear the coming March. Luckily, there's not a very strong correlation between the PM10 values for February and for March (0..63 for the 'Chiang Mai measuring station) so I'm still keeping my fingers crossed
/ Priceless
-
ตารางที่ ๑ แสดงค่าเฉลี่ย ๒๔ ชั่วโมงของ PM10และ AQI ในภาคเหนือ ณ เวลา ๐๙.๐๐ น. วันที่ ๒ มีนาคม ๒๕๕๕
สถานี PM10* AQI** คุณภาพอากาศ
เชียงราย
สนง.ทรัพยากรธรรมชาติและสิ่งแวดล้อมอ.เมือง๒๕๐.๖ ๑๕๗ มีผลกระทบต่อสุขภาพ
สาธารณสุขแม่สายอ.แม่สายจ.เชียงราย๓๒๓.๔ ๑๘๘ มีผลกระทบต่อสุขภาพ
เชียงใหม่
ศาลากลางอ.เมืองจ.เชียงใหม่๑๗๑.๖ ๑๒๒ มีผลกระทบต่อสุขภาพ
โรงเรียนยุพราชวิทยาลัยอ.เมืองจ.เชียงใหม่๑๔๙.๐ ๑๑๓ มีผลกระทบต่อสุขภาพ
พระตำหนักภูพิงคราชนิเวศน์จ.เชียงใหม่ (Mobile)*** ๓๒.๕ ๔๑ดี
ลำพูนสนามกีฬาอบจ. อ.เมืองจ.ลำพูน๑๕๐.๒ ๑๑๓ มีผลกระทบต่อสุขภาพ
Trying to copy this off aqmthai website, doesn't really copy the table but you can get the gist .
Basically all bad but huge difference and improvement up at Phuping if these are correct.
I think that you rather safely assume that the Phuping figures are correct. Doi Pui is at an altitude more than 5,000 feet above mean sea level, and particulate matter pollution rarely reaches that high in any significant concentrations.
/ Priceless
-
Slightly bored of dust levels , I pulled another high stat. off the chart
Numbers for NO2 - these are x10-20 those of other areas being 42-70 ppb in Chiang Mai
However these are in ppb
Found a conversion rate of times 1.91 to put into micrograms per cubic metre which pollutant levels seem to normally be measured in. (there is a longer equation haven't tried that)
http://forum.onlinec...read.php?t=9436
According to this , this would put NO2 levels in Chiang Mai at around 80-130 µg/m3
"There is some evidence that long-term exposure to NO2 at concentrations above 40–100 µg/m3 may decrease lung function and increase the risk of respiratory symptoms.
Nitrogen dioxide is a large scale pollutant, with rural background ground level concentrations in some areas around 30 µg/m3, not far below unhealthy levels."
According to this an NO2 level of over 100 is off the stratosphere and pretty poisonous. Any thoughts on this.
It is worth noting the expression 'long-term exposure'. The World Health Organization has the following to say about short-term exposure:
'The current scientific literature has not accumulated evidence to change from the WHO guideline value of 200 μg/m3 for
1-hour nitrogen dioxide concentration'. (Air Quality Guidelines, Global Update 2005, p376)
/ Priceless
Those are the 1 hour average figures and if you look at those statistics on for example the Australian permitted levels. It says the 1 hour average should be only permittable for 1 day per year.
We are clearly exceeding that at present
Averaging time Maximum concentration (µg/m3) Goals within 10 years Maximum allowable exceedences 1 hour 246 (0.12 ppm) 1 day a year 1 year (State of Victoria)
Yes, I don't intend to argue with you. I have concentrated my interest on PM10 and know very little about other pollutants. Just thought I'd add something that I'd come across 'by accident'.
/ Priceless
-
Jeez this year seems really bad.. OMG... does anyone know what happened to the measuring stations in CM? Have they gotten clogged? Last week there were some strange spikes where pollution went to zero, now there's days and days missing...
According to the Pollution Control Department the 'Chiang Mai' measuring station suffered equipment failure from 25-29 February. I would recommend you to look at the 'Uparaj' station instead.
/ Priceless
-
Slightly bored of dust levels , I pulled another high stat. off the chart
Numbers for NO2 - these are x10-20 those of other areas being 42-70 ppb in Chiang Mai
However these are in ppb
Found a conversion rate of times 1.91 to put into micrograms per cubic metre which pollutant levels seem to normally be measured in. (there is a longer equation haven't tried that)
http://forum.onlinec...read.php?t=9436
According to this , this would put NO2 levels in Chiang Mai at around 80-130 µg/m3
"There is some evidence that long-term exposure to NO2 at concentrations above 40–100 µg/m3 may decrease lung function and increase the risk of respiratory symptoms.
Nitrogen dioxide is a large scale pollutant, with rural background ground level concentrations in some areas around 30 µg/m3, not far below unhealthy levels."
According to this an NO2 level of over 100 is off the stratosphere and pretty poisonous. Any thoughts on this.
It is worth noting the expression 'long-term exposure'. The World Health Organization has the following to say about short-term exposure:
'The current scientific literature has not accumulated evidence to change from the WHO guideline value of 200 μg/m3 for
1-hour nitrogen dioxide concentration'. (Air Quality Guidelines, Global Update 2005, p376)
/ Priceless
-
This year is extraordinary!
[...]
Well not really, I'm afraid. Since the 'Chiang Mai' measuring station suffered a breakdown for four days (25-28 February) I looked at the Uparaj station numbers instead. Of the previous eight years (2004-2011) four had significantly higher February pollution levels than this year (2004, 2005, 2007 and 2009). Two had levels pretty much equal to this year (2006 and 2010). Only 2008 and 2011 were significantly better.
I think what we are facing is the human tendency to remember more recent events (in this case 2011) a lot more strongly and think that these events are the norm. The latter half of February and most of March are usually bad and (so far) this year has followed that pattern.
I'm crossing my fingers that the pattern will be broken this March
/ Priceless
-
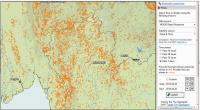
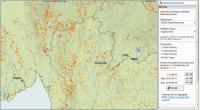
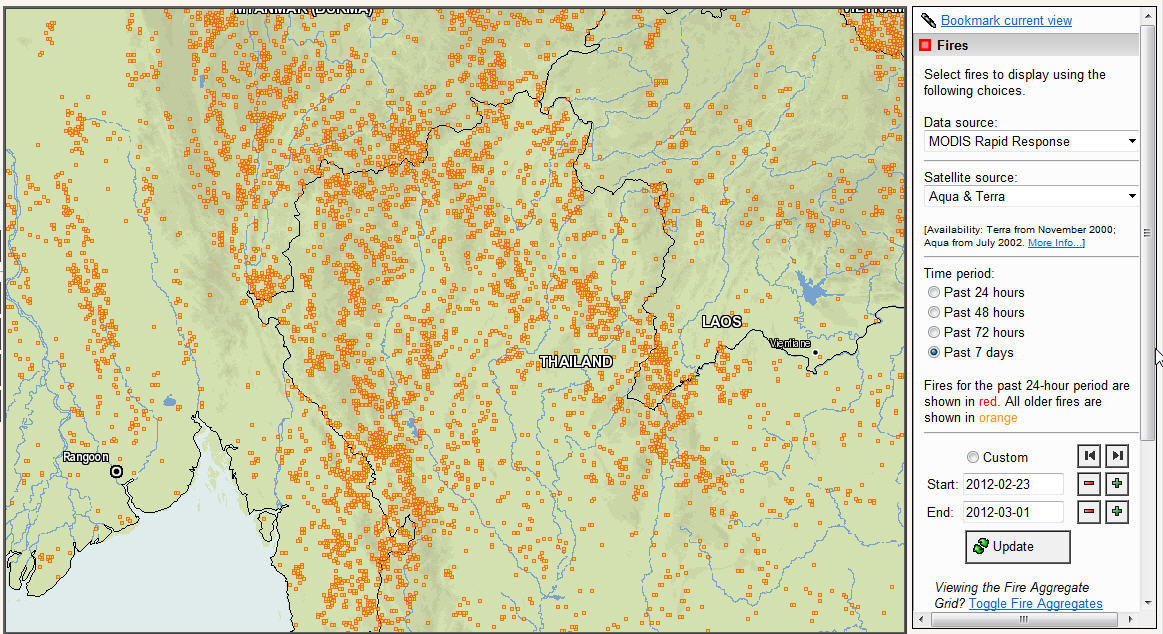
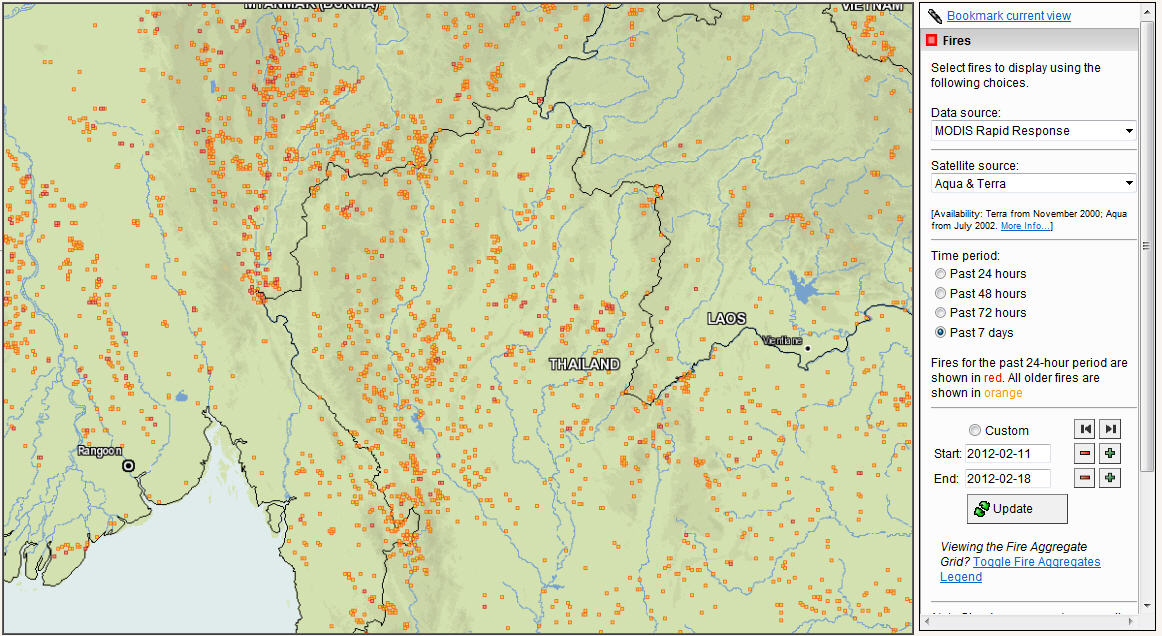
Anybody look at a fire map and see where the fires are coming from? Naw. Too high tech for the new Farang.
I can't say I understand what what you're trying to say, but here's a map (from http://firefly.geog.umd.edu:8080/firemap/?x=99.30937499999999&y=18.009375000000005&z=7&g=g&v=1&r=5&i=er&l=ad,ct ):
/ Priceless
-
Okay, I worked as environmental consultant focusing on air quality for several years, and I don't think the figures you've provided are telling the whole story. Granted, I am American, and I'm clearly translating my own standards of air quality to a place hosting me but, that's what we're all doing on this thread, right? So here is what I'm seeing in these, if anyone cares (to tell me how stupid I am).
First. The standards for PM 10 in the EU and USA can't really be compared to Thailand, which doesn't monitor PM 2.5. The EU and the US focus on the more dangerous PM 2.5. The PM 10 measures are just caps that exist to reinforce other air quality standards. It's a liability, ass-covering limit that doesn't really mean anything. All the meaningful regulations and air quality improvement measures in the US that deal with PM target PM 2.5, and in cleaning up smaller particles, generally the larger particles are cleaned up as well, barring natural disasters such as forest fires. The 150 ug/m3 boundary in the US is to provide an exceptional allowances to account for natural disasters or the convergence of three or four unlikely events at the same time (natural fire PLUS traffic-causing tourist event PLUS wind patterns blowing in significant pollution from elsewhere all converging in ONE air district).
Second. Yes, there are a lot of fires. Yes, there are plenty outside of Thailand as well as inside of Thailand. Fires abound.
Third. This chart deals with monthly and yearly averages. The meaningful representation of PM counts are usually 24-hour or 8-hour averages. Why? Because greater concentrations of PM in the air even in a shorter amount of time do disproportionate lung damage compared to medium-levels over a longer time period. So, we look to the number of instances where PM 10 levels exceeded 120 ug/m3. 18 times in 2010 and 16 times in 2009 is A LOT, especially for a region with the size and population of Chiang Mai. While we don't know what the PM 2.5 levels are, we know that PM 10 and PM 2.5 levels generally share a correlation. Sure, there has been a decline from the 39 instances of PM 10 exceeding 120 ug/m3 in 2002, but that doesn't mean 15+ instances is a good record by any means. I guess I'm not sure what this is trying to prove. Certainly air quality is still quite bad during the burn months.
Fourth. It would make sense that particulate matter, on average, would have declined over the past few years, as cleaner equipment and vehicles are implemented across the region. One of the major ways that governments have tried to control air quality without imposing usage limits or other restrictions on personal behavior is by holding engine manufacturers to higher standards every few years. In the US, these regulations focus first on huge, diesel-fueled engines--the type that power giant bulldozers and industrial trucks and last on smaller engines (>25 HP engines are still largely unregulated). What this means, even for Thailand, on the other side of the world, is that newer vehicles and equipment generally emit less pollution during a lifecycle. For instance, a 2006 model year excavator doing the same work as a 2002 excavator could emit HALF the pollution. What's interesting, is if we look at similar charts from areas in the US, we can see a similar rate of decline, just 2 or 3 years ahead of what's in this chart for Chiang Mai.
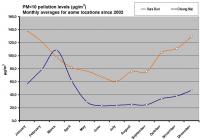
Fifth. This chart shows that Chiang Mai's monthly averages for PM 10 over the last 10 years in March greatly exceed those of a district in Bangkok. February and April averages in Chiang Mai also exceed those of Bangkok. During the rest of the year, Chiang Mai's PM 10 count monthly average is 40 or 50 ug/m3 below Bangkok's. This shows that air quality during the burn season in Chiang Mai is worse than air quality during the same time in Bangkok, despite huge differences in population size, construction/industrial economy, and vehicle miles travelled (all of which are obviously greater in Bangkok).
Sixth. Chiang Mai has almost exceeded the EU PM 10 standard in less than a month, and has surpassed the US standard already. Some of our neighbors have already violated both of those Western standards. I'm thinking this chart will/has been used to discredit that air quality is bad in Chiang Mai, when areas to the East are faring worse right now. Air quality IS regional, as many people in this thread have been eager to point out. Yes, it is possible that burning in Southern China, Myanmar, and Lao have contributed to the poor air quality in Northern Thailand. This does not cancel out the fires burning more closely or change Chiang Mai's geographic disadvantages for keeping the bad air in.
I think, if anything, these charts demonstrate that air quality during this time of the year continues to be a problem. It seems like the voluntary, man-made fires are still the triggering factor in these spikes. The best way to improve air quality during the burning season in Chiang Mai proper is to stop the rates of fires near Chiang Mai. Even if all the fires nearby stopped, Chiang Mai would likely still have terrible air quality in February and March, but the huge spikes (like 180 ug/m3 on 18 Feb) that disproportionally affect health would probably decrease.
Another problem with PM 10 is that is can exacerbate the air basin's hold on other emissions and air pollution as well. Ozone/NOx (smog) and carbon monoxide can get trapped in more than usual, making the soupy air extra soupy.
Last, I didn't see this link already in this thread (but, that doesn't mean it's not there). It's an academic paper disputing most of the claimed benefits of the fires.
Okay. I'm done nerding out about air quality. I have chosen to live in Chiang Mai despite the air quality, and I'm quite aware that as a foreign national I have no right to tell the locals how to do things. It certainly would be nice to get my oxygen fix with less labor, but hey, I've given up lots of my home comforts in favor the way of life here.
I have been off-line for some time, so I have not seen your post until recently.
I have never worked professionally with air pollution. However, I have been an almost daily user, and sometimes producer, of statistics. Since you have posted as a direct reply to my earlier post, I feel obliged to reply to what you are saying.
What I posted is obviouslynot 'the whole story', I don't think anybody has access to that. What I have tried is posting some relevant information that I think might be of interest to some forum members.
--------------------
'The standards for PM 10 in the EU and USA can't really be compared to Thailand, which doesn't monitor PM 2.5. The EU and the US focus on the more dangerous PM 2.5.' I am afraid I don't understand this statement. Firstly, I don't 'compare' the standards, I just presented a table listing them, since there seems to be some confusion about them. Secondly, I don't understand why one couldn't compare PM10 standards because of the fact that USA has implemented a limit for PM2.5 (EU will not have a limit for PM2.5 until 1 January 2015).
--------------------
'Second. Yes, there are a lot of fires. Yes, there are plenty outside of Thailand as well as inside of Thailand. Fires abound.' I don't understand what you are trying to say here. I posted an example and the URL from a site that I have found quite useful (in combination with weather and other data) in trying to understand the pollution patterns. Are you saying that one should just shut up, take a deep breath and go on doing something else?
--------------------
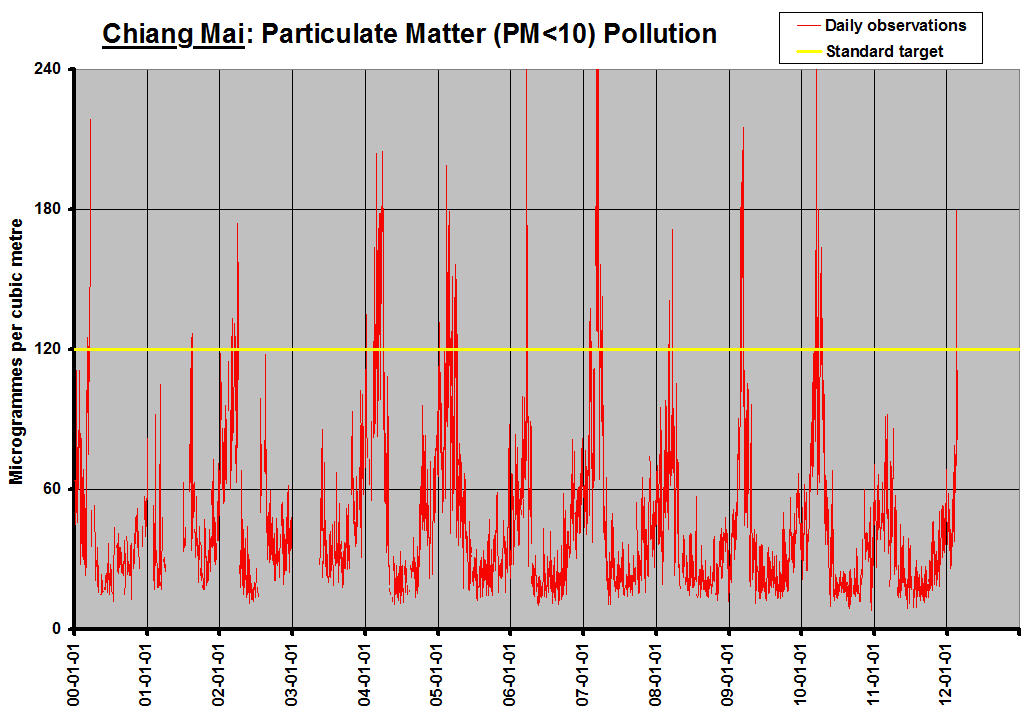
'Third. This chart deals with monthly and yearly averages. The meaningful representation of PM counts are usually 24-hour or 8-hour averages.' It appears that you have not grasped the difference between data collection and information presentation. The raw data for my graphs and tables are of course the 24-hour averages posted by the Pollution Control Department (PCD) on their website. However, there are frequent questions on this forum like 'When does the worst air polluution usually occur?' or 'What is the air quality usually like during October?. I somehow doubt that the people asking such questions would feel very enlightened by the following graph, showing the raw 24-hour averages since the turn of the century:
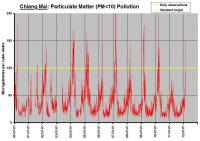
The individual data points can of course also be found in numerical form on the PCD website.
I have no medical background, but I have understood from my readings that long-term exposure is mainly harmful in causing chronic health problems. Short-term exposure, on the other hand, tends to trigger acute conditions, mainly among those with a pre-existing condition, e.g. asthmatics. This should then be the reasoning behind having both long-term (yearly) limits and short-term (24- or 8-hour) limits, with the latter being at much higher levels.
--------------------
'Fourth. It would make sense that particulate matter, on average, would have declined over the past few years, as cleaner equipment and vehicles are implemented across the region.' It would, but does surprisingly not seem to be the case, at least not to any great extent. The most distinguishing feature of air quality (i.e. polllution) in Chiang Mai is the dramatic seasonal swings. If vehicle exhaust were a major factor one would expect to see similar decreases in pollution over the seasons. If you look at the table I posted under 'third', you will see that the monthly averages over, say, May to October (i.e. non-burning season) remain quite stable over the years. Obviously today's vehicles emit less pollutants per vehicle than those of the 1990's or before that. However, you must take into account that the number of vehicles is rapidly increasing here in Thailand. Furthermore, the improvement in emissions per vehicle has not been as dramatic in Thailand as in most Western countries. As far as I know (I am no expert) there are e.g. no particle filtres attached to diesel engines (the vast majority) here. One of the reasons supposedly being that the present quality of diesel sold here does not allow it.
--------------------
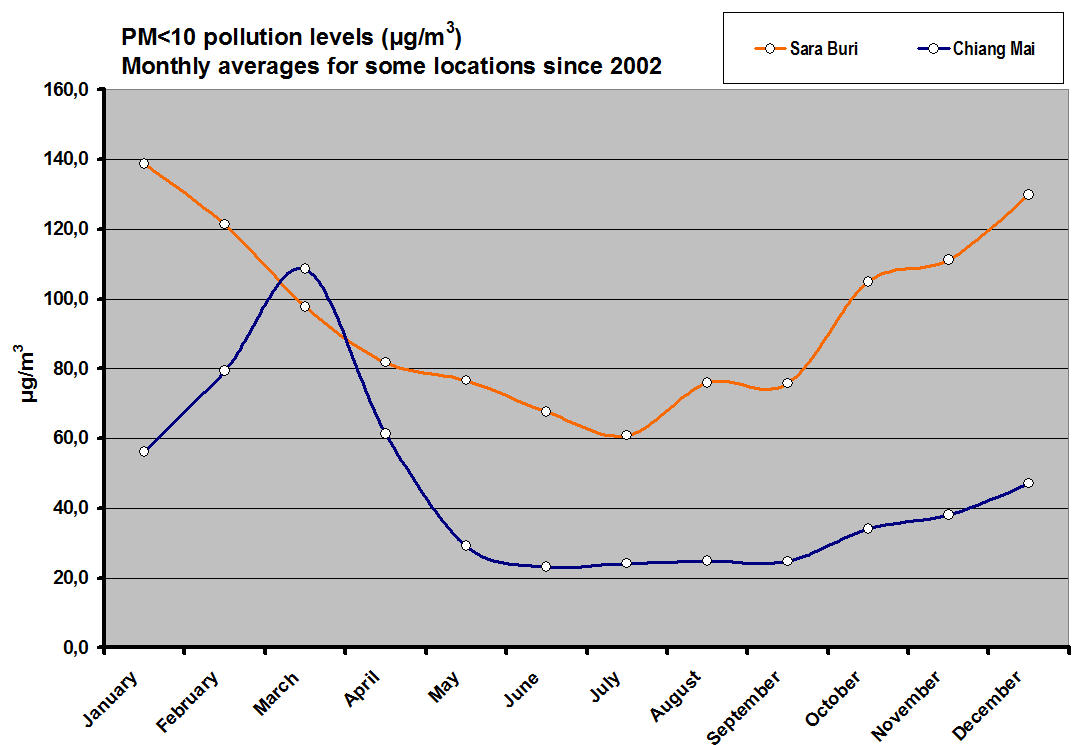
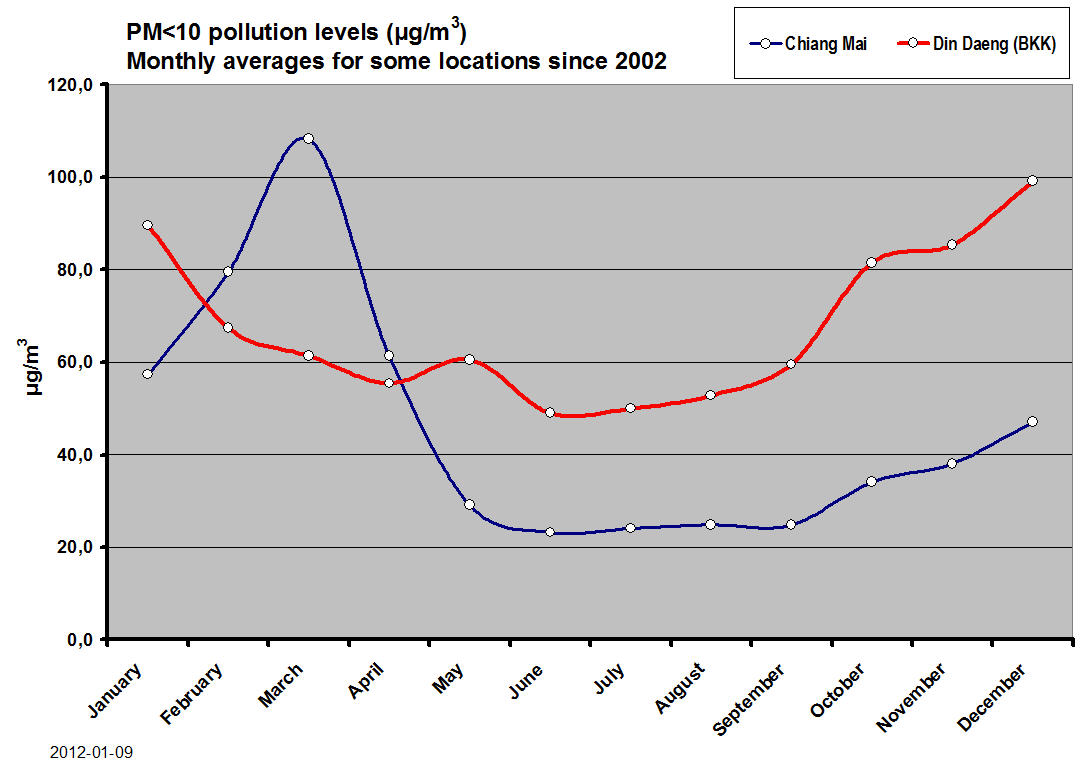
'Fifth. This chart shows that Chiang Mai's monthly averages for PM 10 over the last 10 years in March greatly exceed those of a district in Bangkok. February and April averages in Chiang Mai also exceed those of Bangkok. During the rest of the year, Chiang Mai's PM 10 count monthly average is 40 or 50 ug/m3 below Bangkok's. This shows that air quality during the burn season in Chiang Mai is worse than air quality during the same time in Bangkok, despite huge differences in population size, construction/industrial economy, and vehicle miles travelled (all of which are obviously greater in Bangkok).' As you can see in my original post, this graph was directed at one particular poster ('for the poster who was grateful for living in Bangkok rather than CM'). I would never argue that the air quality in Chiang Mai isn't very bad during the burning season. However, the Din Daeng district of Bangkok isn't highly industrialized, as far as I know it's more of a residential and office district. If you want to compare Chiang Mai to the industrial heartland of Thailand, compare it to e.g. Sara Buri:
--------------------
'Sixth. Chiang Mai has almost exceeded the EU PM 10 standard in less than a month, and has surpassed the US standard already. Some of our neighbors have already violated both of those Western standards. I'm thinking this chart will/has been used to discredit that air quality is bad in Chiang Mai, when areas to the East are faring worse right now.' I don't know where you have got this idea. It is certainly not in anything I have written, and I resent being labelled with an obviously false statement.
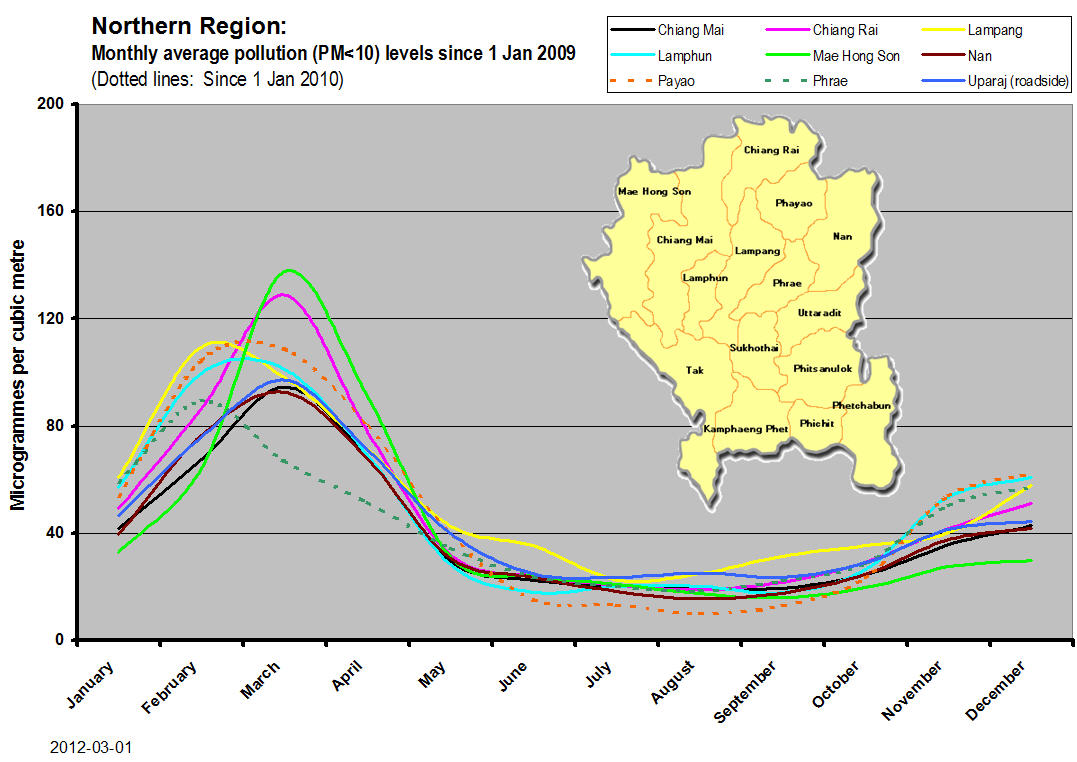
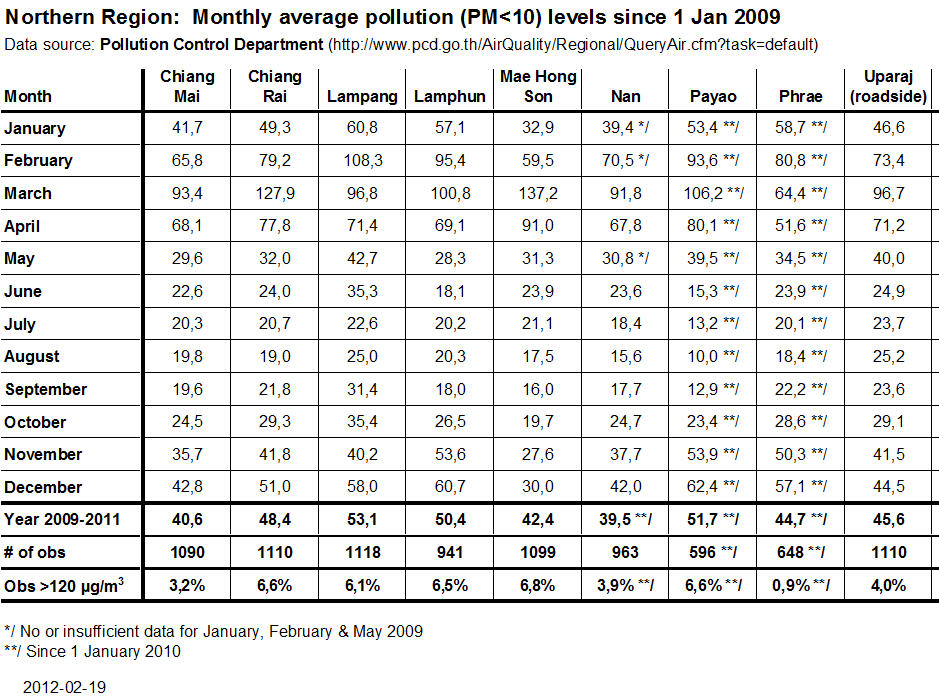
What I have said on occasion is that pollution in Chiang Mai appears to be somewhat less severe than that in most of the Upper North. An explanation for this could be that Chiang Mai is 'protected'. by the mountain ranges surrounding it on three sides. A piece of circumstantial evidence could be the following graph (the cause of the odd-looking curve for Phrae is some suspicious-looking numbers for February and March 2010):
--------------------
/ Priceless
--------------------
-
Sorry, if you don't get the basic facts right then none else you write makes sense.
Wow. How rude are you? What facts are wrong here? This problem is getting gradually worse over time and the areas getting burnt are also increasing. So in the number of cars and traffic and industry along with population growth.
Also you need to check you English in that sentence if you are being so picky. And, yes I have read the topic thank you.
If you "have read the topic", please reread post #136 above, in particular looking at the fourth picture/graph. Maybe you can get somebody to explain it to you. The problem is NOT getting worse, the situation has been dramatically improving for the last 7½ years. At least this is true in Chiang Mai, which is what we are discussing in this forum.
/ Priceless
-
Secondly, please explain why, if "this year the burning started around mid October !!!" the pollution level for October of last year (I assume that you mean 2011) was 18% below the 2002-2011 average (November was even lower)? Incidentally, the whole of last year (i.e. 2011) was the least polluted since the Pollution Control Department started posting their measurements in the late '90s. There was not one single day in excess of 120 µg/m3 (the Thai standards limit), in fact the highest value measured during the whole year was 92.0.
The above data are from the measuring station at the Provincial offices, at Yupparaj College in the old town, the October value was 25% below the 2002-2011 average.
/ Priceless
Annabel is correct, the ricefield burning to the east of the city started soon after the harvest in October, & continued well into December. If you live & work out in those areas you certainly notice it. Going by the figures you quote, it's obvious that this burning doesn't affect the whole valley, especially where the monitoring stations are. For me, where I live SE of the city, it's been a worse than average dry season, pollution wise.
January was OK, the last 2 weeks of January exceptionally clear. The last 2 weeks have seen the air quality deteriorating until we got the real smog last week.
Living SE of the city, maybe the Lamphun data are more relevant to you. You can compare in the below table and see that the Lamphun air quality over the last 3+ years has been considerably worse than that of Chiang Mai:
Average pollution about 25% higher and the number of "bad days" twice as high as CM

/ Priceless
-
Excuse me but if you have lived here for the past 5 years you would have also noticed that the pattern continuously changes... FYKI this year the burning started around mid October !!! As soon as Chiang Mai was over the Flood Shock that we had end Sept and it was dry enough they were already Burning big time ... don't know where you live but maybe need a little reality check at your end...?? Last year the burning started end Dec and went on till end Feb and then for some odd reason crazy rains kicked in and there was no more burning .... Again... where do you live ???
Firstly, it might be wise to "turn down your volume" a bit. There are a lot of posters on this forum that have lived here a lot longer than five years, some for decades.
Secondly, please explain why, if "this year the burning started around mid October !!!" the pollution level for October of last year (I assume that you mean 2011) was 18% below the 2002-2011 average (November was even lower)? Incidentally, the whole of last year (i.e. 2011) was the least polluted since the Pollution Control Department started posting their measurements in the late '90s. There was not one single day in excess of 120 µg/m3 (the Thai standards limit), in fact the highest value measured during the whole year was 92.0.
The above data are from the measuring station at the Provincial offices, at Yupparaj College in the old town, the October value was 25% below the 2002-2011 average.
/ Priceless
-
I came back yesterday to CM after a short trip, and I certainly agree that the pollution level today was highly unpleasant, to say the least! (Also officially classified as "out of bounds".) Just to comment on some of what has been said earlier in this thread, however:
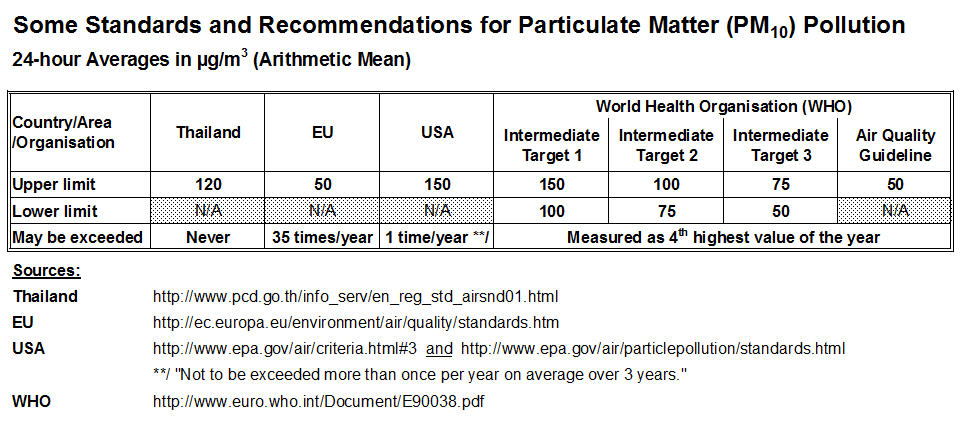
First some standards and recommendations from different organisations:
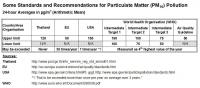
Note that the EU standard (50 µg/m3) may be exceeded 35 times/year, i.e. what the standard means is that the 36th highest value in a calendar year may not exceed that value. In theory there could be several days of 300-500 without exceeding the standard!
Second a rather useful map of current/recent fires from University of Maryland ( http://firefly.geog....=5&i=er&l=ad,ct ):
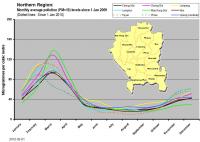
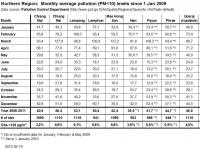
Third a table of monthly and yearly averages in CM for the last ten years (N/A means that >25% of observations for that year/month are missing). Note that the burning (or at least the pollution) does not start earlier and earlier for each year:
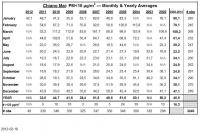
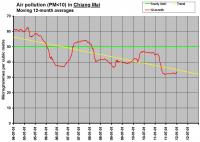
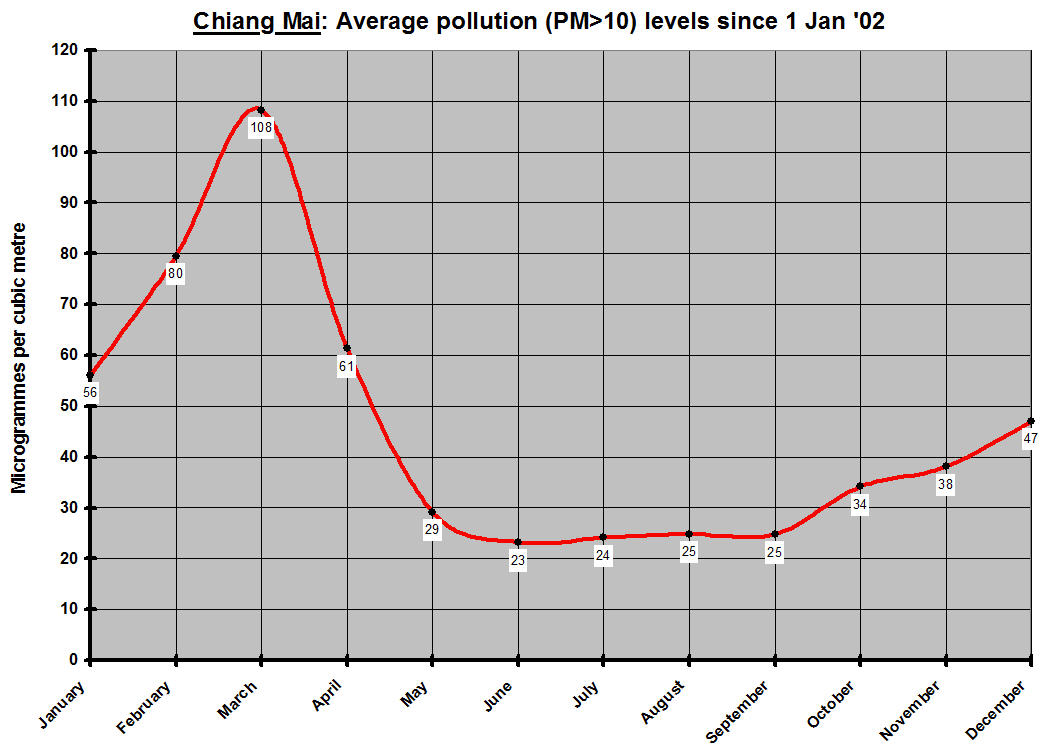
Fourth a graph showing moving twelve-month average levels since mid-2004 and, maybe more interestingly, a trend line for that time. Note that the trend has fallen from 56 in mid 2004 to 35 at the end of 2011, i.e. a decrease by more than a third. Quite an amazing improvement in such a relatively short period of time. (Maybe one should not be too quick in saying that the Thais don't do anything about the problem.):
Fifth for the poster who was grateful for living in Bangkok rather than CM, here's a comparison of average pollution levels for CM and Din Daeng district of Bangkok:
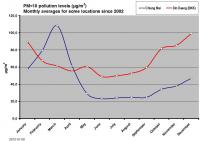
From this graph you can also see that the worst of the year in CM is normally the latter part of February (where we are now) and most or all of March.
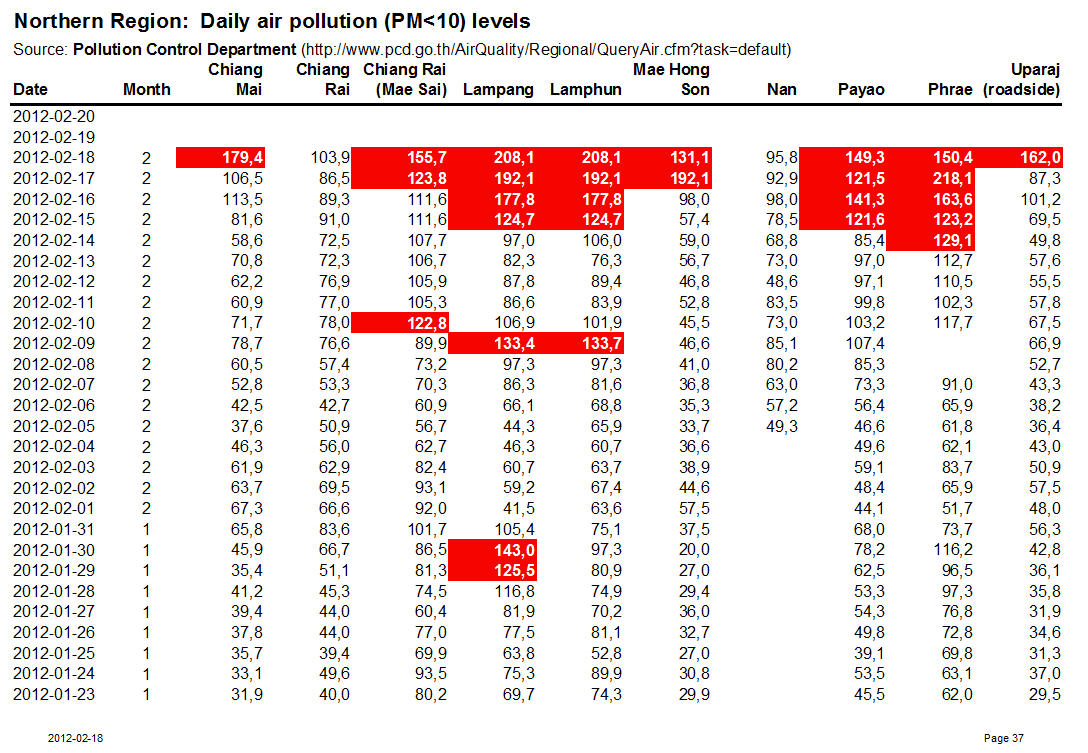
Sixth and finally, here are the numbers for the Upper North over the last four weeks or so (as they are a bit difficult to find and understand on the new PCD website):

/ Priceless
-
 2
2
-
-
"doctors...love to give you antibiotics...."
I wash my hands of such generalities, particularly as I've known a number these days who avoid many meds without clearly established cause.
Indeed, the doc's notice above illustrates home treatment before requesting medical care.
In any case, if one is greatly worried, it is quite inexpensive to see a doctor; peace of mind is nice.
agree with most everything u said here ... but I doubt dr. morgan is ur typical thai doctor. ...beyond the name, the wording of the letter hints at it... though its juest a guess
re antibiotics, my experience has been otherwise, but hoping the doctors u speak of pass this practice on ...
Posted with Thaivisa App http://apps.thaivisa.com
Dr. Morgan is certainly not your typicalThai doctor. She is very much Thai though, from Isarn, but her husband is Welsh (and not in any kind of medical profession).
/ Priceless
-
I would try 'Peera Pharmacy' in Ratchadamnoen, the first one on the left hand side when you come from Thapae Gate. I don't know the price for the tester, but they sell me my strips (Accu-Check Performa) @ 450 baht per 25 strips.
/ Priceless
thanks.... will give this a go. .. maybe best bet is ebay. $20 shipped then hope not to get dinged too hard on vat etc... will check this place first though. thanks again
Posted with Thaivisa App http://apps.thaivisa.com
$20 is over 600 baht, sounds expensive!
/ Priceless
-
I would try 'Peera Pharmacy' in Ratchadamnoen, the first one on the left hand side when you come from Thapae Gate. I don't know the price for the tester, but they sell me my strips (Accu-Check Performa) @ 450 baht per 25 strips.
/ Priceless
-
OhDearGod. So they're having to bus people in to buy their crap 'furniture' etc, and all you farang are over the moon at having the option of furnishing your little palaces witth their shit, same Index with the woefully ignorant Thais (Index cheap crappy imports) before them.
Take the time to find locally produced furniture which will last more than six months AND throw on some soft furnishings/have upholstered.
Memories of 'back home' in short supply here. Together with 'taste'.
When I moved to Thailand in 2006 I brought with me all my things, including a lot of IKEA furniture. Dining table and chairs, bookcases, a leather sofa, an easychair etc, 15-20 pieces in all. These things are now 10-15 years old and in excellent condition. Had they been 'crap' or 'shit' they would have perished long ago.
What IKEA produce and sell is certainly not top-of-the-line handcrafted furniture fashion and future museum pieces, but good value for money for people with more sense than craving for status. In my opinion and experience they are doing quite a good job of it, too. They would probably not have been as successful as they have if they had tried to flog 'crap' to the unsuspecting masses.
/ Priceless
-
1
-
-
March April is the time to avoid. It's about luck of precipitation. A dry year would make a horrible March April. Last year was great but I remember a few years ago when it was really bad. Almost comically bad. Anderson Coopers people showed up and if CNN is visiting then you know something is jacked.
I am headed to the states in a few weeks. Don't want to push my luck.. last year i stayed and got rewarded when the rains came early.
I like bicycle riding and it brings me to my knees with sinus and breathing irritation.. The rest of the year is pretty good if one avoids major roads and road time.
In fact, as one can see from the graph, February (latter part) and March is really the time to avoid:

The April 'a few years ago' that CobraSnakeNecktie remembers was that of 2010. This was extreme for April with a pollution level 67% higher than average and actually more than 40% over the second highest (which was back in 2004).
/ Priceless
-
Could somebody ('chiangmaiexpat'?) please tell me where I can find the current measured pollution levels? The Pollution Control Department hasn't yet published any readings for this month.
/ Priceless
PS The monthly value for January was 25% below the 2002-2012 average

-
If you and/or your girlfriend prefer Thai food, Khaomao Khaofang is a very nice place, romantic with excellent food and service:
http://chiangmai.onl...1_26_38_83.html
/ Priceless
-
My apologies, I hadn't noticed your second post where you said that Thai subtitles are required.
There is a DVD shop on the road from Suthep Rd towards Wing 41, It's on the left hand side, maybe 25 meters in from Suthep Rd. They're supposed to have a very large stock of hard-to-get movies. Might be worth a try...
/ Priceless
-
If Thai subtitles are not a requirement, both amazon.com and amazon.co.uk have it.
/ Priceless
-
It seems to be very high, second highest in the country.
http://www.nci.go.th...0IV/C-II-11.PDF
In Chiang Mai, lung cancer is
the most important site in men and
the second place in women. Cervix
cancer is the leading cancer in
women. The incidence of cervix
cancer in women is the highest
amongst the nine registries.
In Lampang, the profile of
leading cancer in men is similar to
that in Chiang Mai. Lung cancer in
men is even higher than in Chiang
Mai
http://www.nci.go.th...0IV/C-II-01.PDF
scary read
It appears that the incidence of lung cancer is indeed high in Chiang Mai. I have read several reports on research into the reasons for this and there seems to be somewhat of a consensus that a major reason is a fungus, Microsporum canis, that is common in certain areas of Chiang Mai. An abstract of one report is here: http://cat.inist.fr/?aModele=afficheN&cpsidt=1212389
I have not found any reports pointing to ambient air pollution, which should not be surprising since Chiang Mai has among the lowest average yearly pollution levels in Thailand.
Another fact worth pointing out is that Chiang Mai actually has lower total cancer incidence than the average for Thailand:
"Cancer has been the leading cause of death in Thailand with the age-adjusted mortality rate from the two cancer registries being 89.7 per 100 000 in males, 67.2 per 100 000 in females in Khon Kaen and 133.3 in males, 121.0 in females in Chiang Mai (1,2). The estimated age-adjusted incidence rates of cancer for all sites in Thailand were 150.4 per 100 000 for males and 123.0 for females (3), which are not that significant when compared with earlier data (149.6 for males and 125.2 for females) (4). The incidence rates are comparable to those in Asian countries but about half of those in Western countries"
(Source: http://jjco.oxfordjournals.org/content/32/suppl_1/S82.full )
/ Priceless


Smoke, Smog, Dust 2012 Chiang Mai
in Chiang Mai
Posted
At the 'Chiang Mai' measuring station (near the Provincial Hall) it measured 171.6 µg/m3. Since you are a ways north of town, it might be more relevant to look at Chiang Rai at 250.6 (or even Mae Sai at 323.4!!!!!).
Please accept my deepest sympathy
/ Priceless